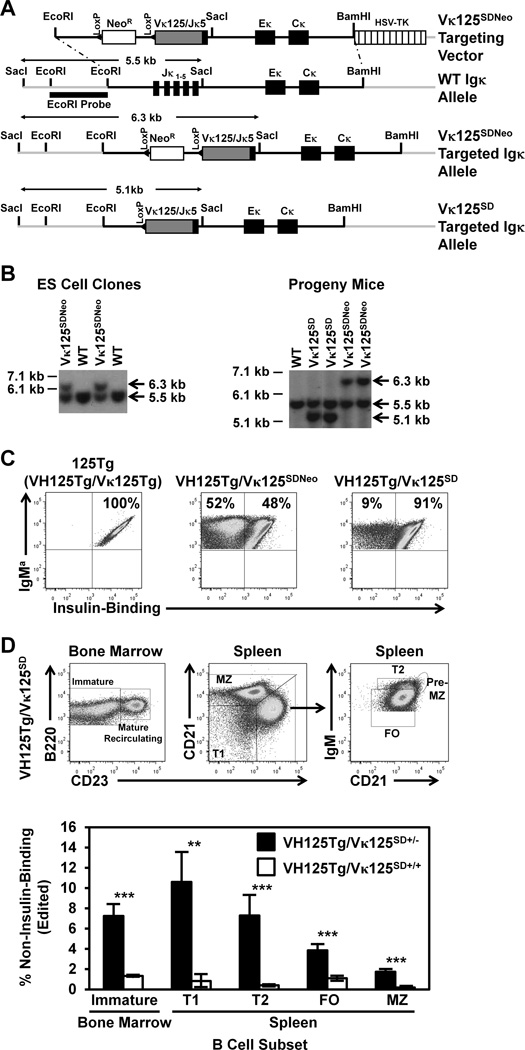
Figure 1. A proportion of anti-insulin B cells lose insulin-binding specificity in the presence of endogenous insulin in the Igκ transgenic model, VH125Tg/Vκ125SD.
(A) Targeting vector schematic, showing WT (non-targeted), targeted Vκ125SDNeo (NeoR gene retained), or targeted Vκ125SD (NeoR gene removed) alleles. (B) ES cell clones (Left) or progeny mouse tail DNA (Right) were digested with SacI and the following alleles were identified by probe hybridization: WT (5.5 kb), Vκ125SDNeo (6.3 kb), or Vκ125SD (5.1 kb, NeoR gene removed). (C) Splenocytes were freshly isolated from VH125Tg/Vκ125Tg (125Tg, Left), VH125Tg/Vκ125SDNeo (Middle), and VH125Tg/Vκ125SD (Right) C57BL/6 mice. Insulin-binding B cells were identified among B220+ IgMa+ live lymphocytes using flow cytometry, confirming expression of anti-insulin Vκ125. Data are representative of progeny from 6 independent founder lines. (D) B cell subsets were identified among B220+ live lymphocytes as follows: bone marrow: immature (IgM+ CD23−) or mature recirculating (IgM+ CD23+); spleen: T1 (CD21low CD23low IgMhigh), T2 (CD21mid CD23high IgMhigh), FO (CD21mid CD23high IgMmid), Pre-MZ (CD21high CD23high IgMhigh), and MZ (CD21high CD23mid IgMhigh), as shown by representative flow cytometry dot plots of VH125Tg/Vκ125SD mice (Top). Flow cytometry was used to assess the average percentage ± SD of non-insulin-binding (edited) B cells within the indicated B cell subset in n = 3 VH125Tg/Vκ125SD+/− (black) or n = 4 VH125Tg/Vκ125SD+/+ (white) B6 mice (Bottom). ** p < 0.001, *** p < 0.001, two-tailed t-test.

