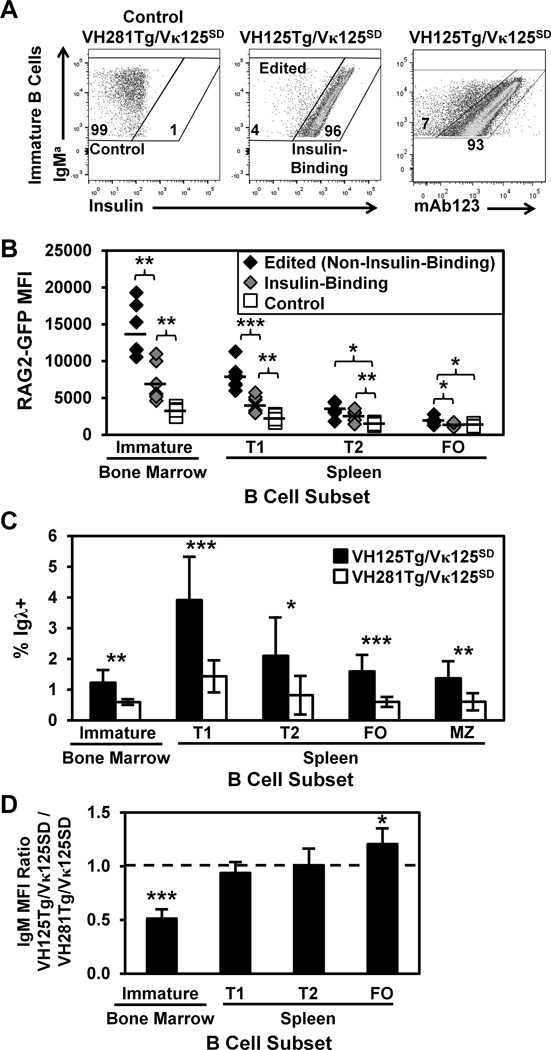
Figure 2. Anti-insulin specificity correlates with increased RAG2-GFP expression in developing B lymphocytes.
B cell subsets were identified in freshly isolated bone marrow and spleen as in Fig. 1D. (A) Representative flow cytometry plots of immature B cells depict Control (non-insulin-binding, Left), Edited (non-insulin-binding, Middle), or Insulin-Binding (Middle) B cells, based on reactivity with biotinylated insulin. Biotinylated mAb123 detects insulin-occupied BCR on immature VH125Tg/Vκ125SD B cells using flow cytometry (Right). (B) Immature, T1, T2, or FO B cell subsets were identified in n ≥ 6 VH125Tg/Vκ125SD/RAG2-GFP/B6 or control VH281Tg/Vκ125SD/RAG2-GFP/B6 5–12 wk old mice, in which GFP expression is driven by the RAG-2 promoter. RAG2-GFP MFI is shown for Edited/Non-Insulin-Binding (black diamonds), Insulin-Binding (grey diamonds), or control (white squares) populations identified as in Panel A that were GFP+. Averages are indicated by bars. (C) The average percentage ± SD of Igλ+ cells in the indicated B cell subset was compared between n ≥ 7 VH125Tg/Vκ125SD/B6 (black) and control VH281Tg/Vκ125SD/B6 (white) mice. (D) Flow cytometry was used to measure surface IgM expression on the indicated B cell subsets in n ≥ 7 mice per group. The IgM MFI of VH125Tg/Vκ125SD cells was divided by the IgM MFI of VH281Tg/Vκ125SD B cells within the developmental subset indicated. A value < 1 indicates lower IgM expression in VH125Tg/Vκ125SD B cells; the average ratio ± SD is shown. * p < 0.05, ** p < 0.001, *** p < 0.001, two-tailed t-test (B–C) or one sample, two-tailed t test (D).

