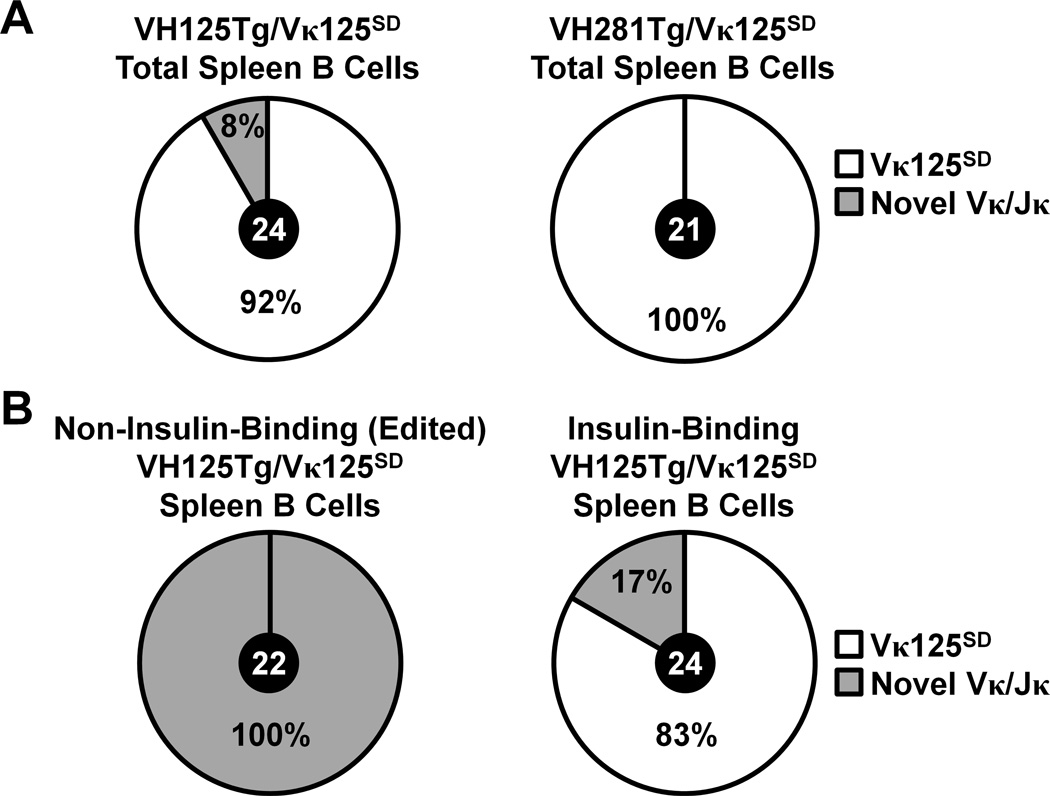
Figure 3. Insulin autoantigen recognition is associated with replacement of Vκ125SD in VH125Tg/Vκ125SD B lymphocytes that lose the insulin-binding specificity.
Flow cytometry sorting was used to purify B cell populations from freshly isolated spleens. Cells were sorted into RNA lysis buffer, RNA was purified, cDNA was generated, and PCR was used to amplify Igκ as in Methods. The number of clones (black circle, center) and percentage of isolates that expressed the targeted Vκ125SD allele (Vκ4-74 Jκ5, white) or Novel Vκ/Jκ (grey) is indicated for each sorted population. (A) Total B cells (B220+ IgMa+ live lymphocytes) were purified from n = 2 VH125Tg/Vκ125SD/B6 (Left, GenBank Accession #KT250658- KT250681) or n = 2 VH281Tg/Vκ125SD/B6 (Right, GenBank Accession # KT250637-KT250657) mice. (B) Non-insulin-binding (Left, GenBank Accession # KT250682-KT250703) or insulin-binding (Right, GenBank Accession # KT250704-KT250727) total B cells (gated as in Panel A) were purified from n = 3 VH125Tg/Vκ125SD/B6 mice.

