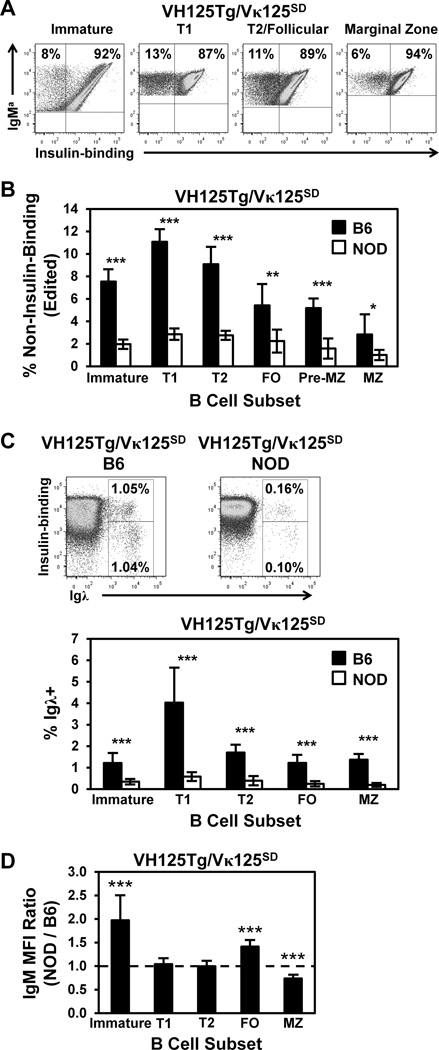
Figure 4. Anti-insulin B cells undergo receptor editing less efficiently in the type 1 diabetes-prone NOD strain.
B cell subsets were identified using flow cytometry as in Fig. 1D in VH125Tg/Vκ125SD bone marrow or splenocytes freshly isolated from 8 –12 week old B6 (black) or NOD (white) mice. (A–B) The percentage of non-insulin-binding (edited) B cells was assessed within the indicated subset using flow cytometry Representative dot plots (A) and the average ± SD (B) is shown for n = 6 B6 or n = 7 NOD VH125Tg/Vκ125SD mice, n ≥ 2 experiments. (C) The percentage of Igλ+ B cells were further identified in total spleen as shown in representative plots (Top). The average total Igλ+ % ± SD in each subset is indicated for n ≥ 8 mice, n = 3 experiments (Bottom). (D) The IgM MFI of VH125Tg/Vκ125SD/NOD B cells was divided by the IgM MFI of VH125Tg/Vκ125SD/B6 B cells within the developmental subset indicated, n = 10 mice, n= 4 experiments. A value > 1 indicates higher IgM expression in NOD. * p < 0.05, ** p < 0.001, *** p < 0.001, two-tailed t-test (B–C), or one sample, two-tailed t test (D).

