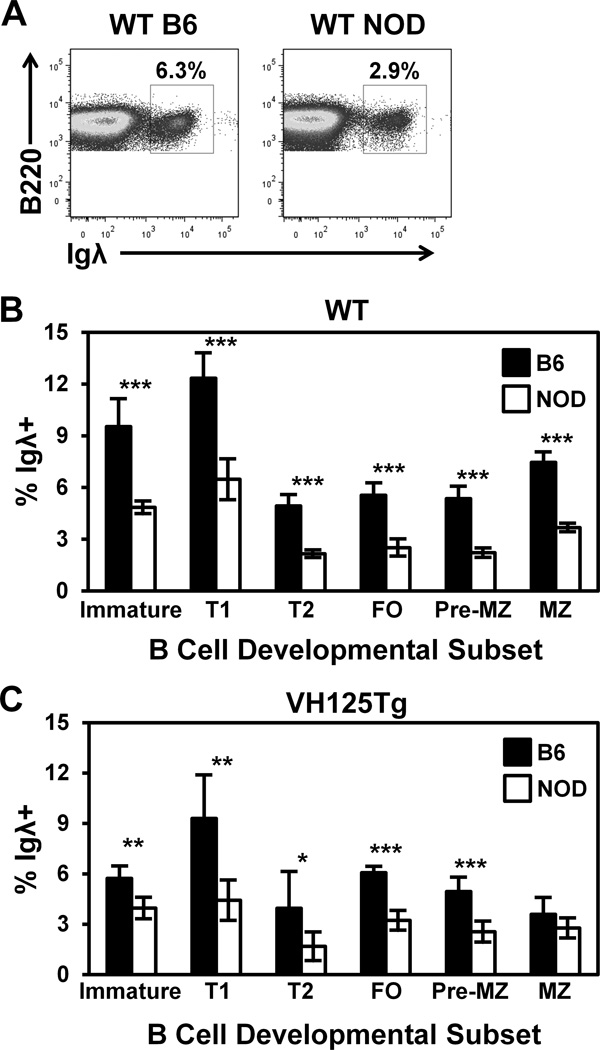
Figure 5. Igλ usage is reduced in NOD mice, even in the absence of H chain usage bias.
B cell subsets were identified in freshly isolated bone marrow or spleen using flow cytometry as in Fig. 1D and the percentage of Igλ+ B cells was assessed in NOD or B6 mice, representative plots are shown in (A). The average Igλ % ± SD is shown for WT (B) or VH125Tg (C) B6 (black) or NOD (white) mice, n ≥ 6 8–12 week old mice per group, n ≥ 2 experiments. * p < 0.05, ** p < 0.001, *** p < 0.001, two-tailed t-test.

