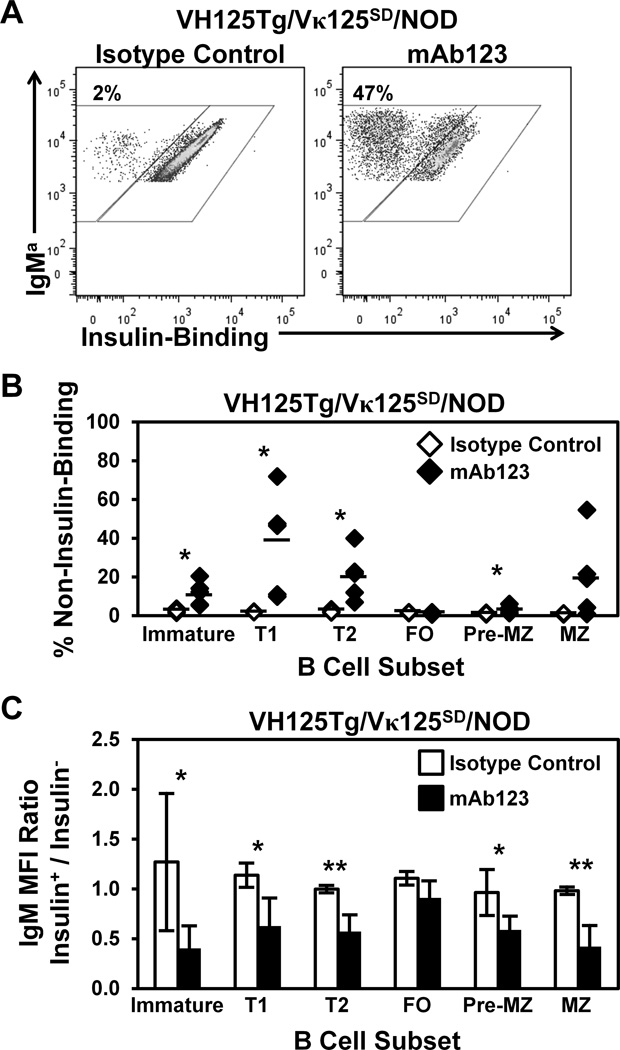
Figure 6. Faulty central tolerance in NOD mice is ameliorated by treatment with insulin autoantigen-targeted mAb123.
6–13 week old VH125Tg/Vκ125SD/NOD mice were injected i.p. once with 100 µg anti-insulin mAb123 (black, n = 5) or isotype control mAb (white, n = 4). Bone marrow and spleens were harvested 2–7 d later and B cell subsets were identified as in Fig. 1D, further gated as non-insulin-binding or insulin-binding B cells. (A) Representative flow cytometry plots for isotype control mAb (Left) or mAb123 (Right). (B) Individual mice are plotted, bars indicate the average. (C) The IgM MFI of insulin-binding (Insulin+) B cells was divided by the IgM MFI of non-insulin-binding (Insulin−) B cells in the same mouse. A ratio < 1 indicates reduced surface IgM expression in the insulin-binding population (relative to edited B cells). Bars indicate the average Insulin+ / Insulin− IgM ratio ± SD. * p < 0.05, ** p < 0.01, *** p < 0.001, two tailed t test.

