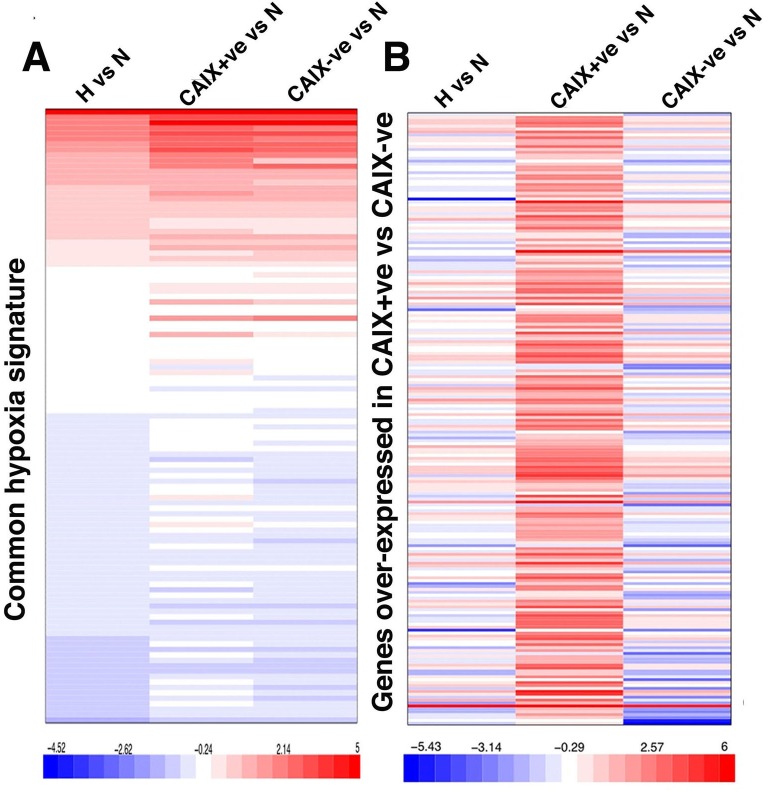
Figure 3. CAIX-positive and negative populations show similar hypoxia transcriptional response.
A. Expression of known hypoxia regulated genes, B. genes over-expressed in the CAIX positive population are shown in the three experimental conditions: 1) whole-population (left column), 2) CAIX+ve population (middle column) and 3) CAIX-ve population (right column) exposed to hypoxia normalized to the normoxia whole-population control. Bar legend shows the log2 count ratio between hypoxia and the normoxia.

