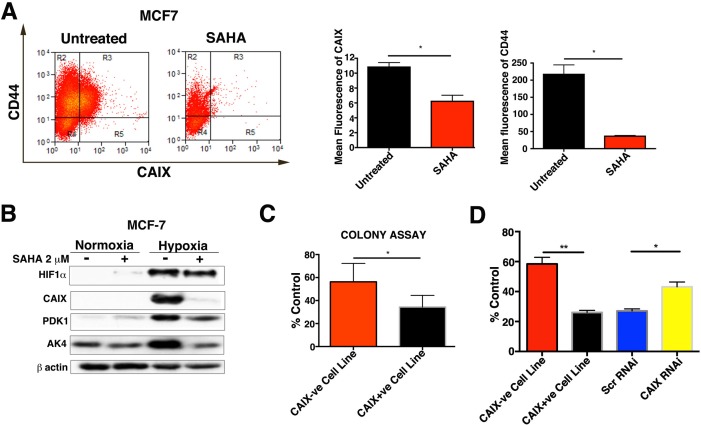
Figure 8. Effects of SAHA treatment on CAIX+ve and CAIX-ve populations.
A. FACS analysis for CAIX and CD44 in hypoxia in SAHA treated and untreated MCF-7. B. Protein levels of HIF-1α, CAIX, PDK1 and AK4 in SAHA treated and untreated MCF-7 cells. C. Clonogenic survival assay for MCF7 CAIX+ve and CAIX-ve cell lines treated with SAHA. D. Effects of SAHA treatment on cell growth of MCF7 CAIX+ve, MCF7 CAIX-ve and MCF7 CAIX knockdown cells. Error bars represent the mean ± SD. **p < 0.01, *p < 0.05, n = 3.

