
Figure 3.
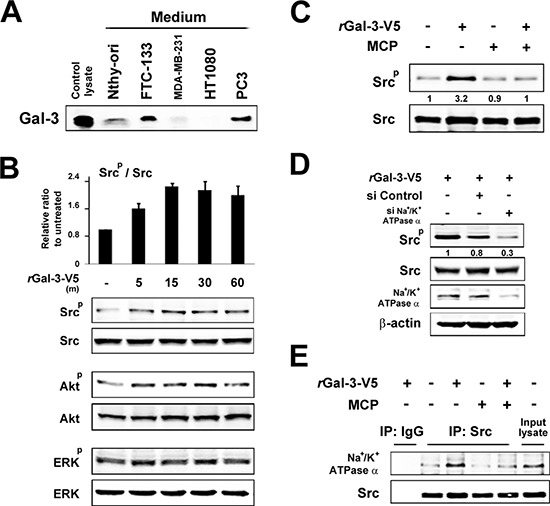
A. The indicated cell lines were starved for 24 h in media lacking FBS. The protein in conditioned media was concentrated with 3K centrifugal filters. After BCA assay, equal amounts of proteins were separated using SDS-PAGE. Western blot analysis shows Gal-3 expression in conditioned media with polyclonal anti-Gal-3 antibody. B. HT1080 cells were starved for 24 h in media lacking FBS and then treated with 0.5 micromolar rGal-3-V5. Kinetic analyses were done at the times indicated. Analyses of p-Src were normalized to Src (Upper panel ). The relative value of untreated cells was set as 1. Columns represent the mean of two independent experiments; bars, SE. Western blot analyses show the representative data of p-Src, p-Akt and p-ERK (Lower panel ). C. HT1080 cells were either left untreated or treated with 1% of GCS-100/MCP, 30 min later, treated with 0.5 micromolar rGal-3-V5 for 15 min. Western blot analyses were performed with p-Src or Src antibody. Numbers represent the relative intensity of p-Src normalized to Src. The value of untreated cells was set as 1. D. HT1080 cells were transfected with 10 nM of si-Control or si-Na+/K+-ATPase alpha1 for 24 h, and then starved in media lacking FBS. At the same time, they were either untreated or treated with 0.5 micromolar rGal-3-V5 for 15 min. Western blot analyses were performed with p-Src, Src or Na+/K+-ATPase alpha1 antibody beta-actin was used as the loading control. Numbers represent the relative intensity of p-Src normalized to Src. The value of cells treated with rGal-3-V5 alone was set as 1. E. HT1080 cells were treated as in C. Cell lysates were immunoprecipitated with IgG or Src antibody. Immunoprecipitates were analyzed by immunoblotting with Na+/K+-ATPase alpha1 or Src antibody. Input lysate from HT1080 was used as control.