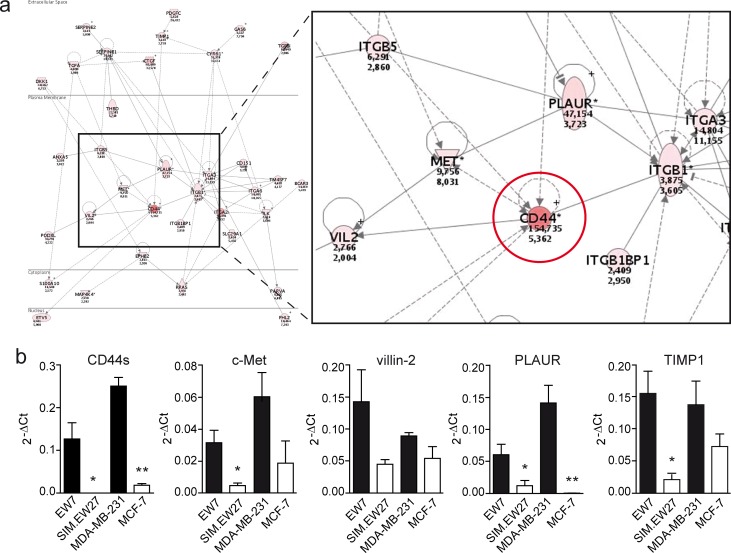
Figure 1. Vasculogenic tumor cells show enhanced expression of CD44/c-Met signaling components.
A. Ingenuity Pathways Analysis of microarray data showed enhanced activation of the CD44/c-Met signaling cascade. Red colors indicate enhanced expression in VM+ tumor cells. Encircled is CD44. B. Validation of the microarray data by qRT-PCR analysis of CD44s, c-Met, villin-2, PLAUR, and TIMP1 expression in the Ewing sarcoma (EW7, SIM.EW27, n = 4) and breast carcinoma (MDA-MB-231, MCF7, n = 3) cell lines. Black bars indicate VM+ cell lines; white bars indicate VM− cell lines. Values represent the mean±SEM. *p ≤ 0.05, **p ≤ 0.01.

