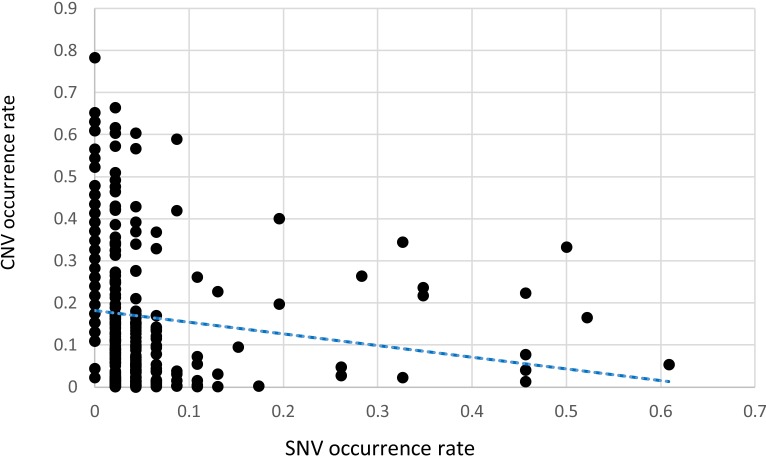
Figure 3. A scatter gram and regression line depicting the relationship between SNVs and CNAs in OSCC specimens.
The x-axis indicates the fraction of the 46 targeted genes harboring SNV, whereas the fraction of the 46 targeted genes harboring CNAs is depicted on the y-axis. Each point indicates a tumor specimen. In general, CNA were more common than SNV in the targeted genes. The regression line indicates an inverse relationship between the occurrence of SNVs and CNAs.

