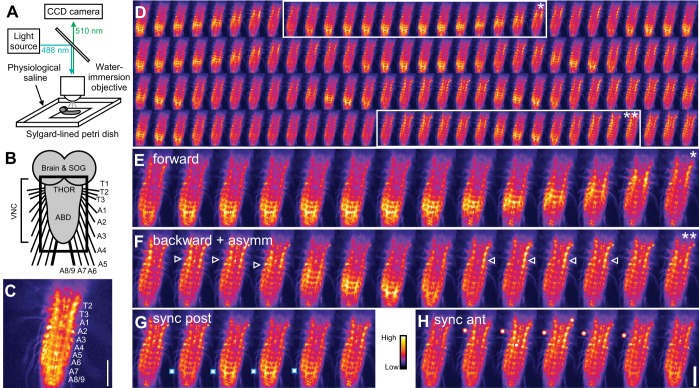
Fig. 1.
Ca2+ signals in the isolated central nervous system (CNS) of larval Drosophila. A: experimental setup. B: diagram of CNS. Black square indicates region imaged in following panels. SOG, subesophageal ganglion; THOR, thorax; ABD, abdomen; VNC, ventral nerve cord. C: still image of Ca2+ signal. CNS segments labeled from thoracic segment 2 (T2) to fused abdominal segment A8/9. D: sequence of still images of Ca2+ signals, running from top left to bottom right; successive images are 1.9 s apart. Posterior-to-anterior (forward, *) and anterior-to-posterior (backward, **) Ca2+ waves are shown. E and F: magnified view of forward wave (E) and backward wave (F), also showing bilaterally asymmetric activity in thoracic and anterior abdominal segments (white arrowheads). G and H: synchronous activity in posterior (G) and anterior (H) segments. Raw fluorescence intensity is indicated by color map scale bar. GAL4 Driver: OK371-GAL4. Scale bars, 100 μm.

