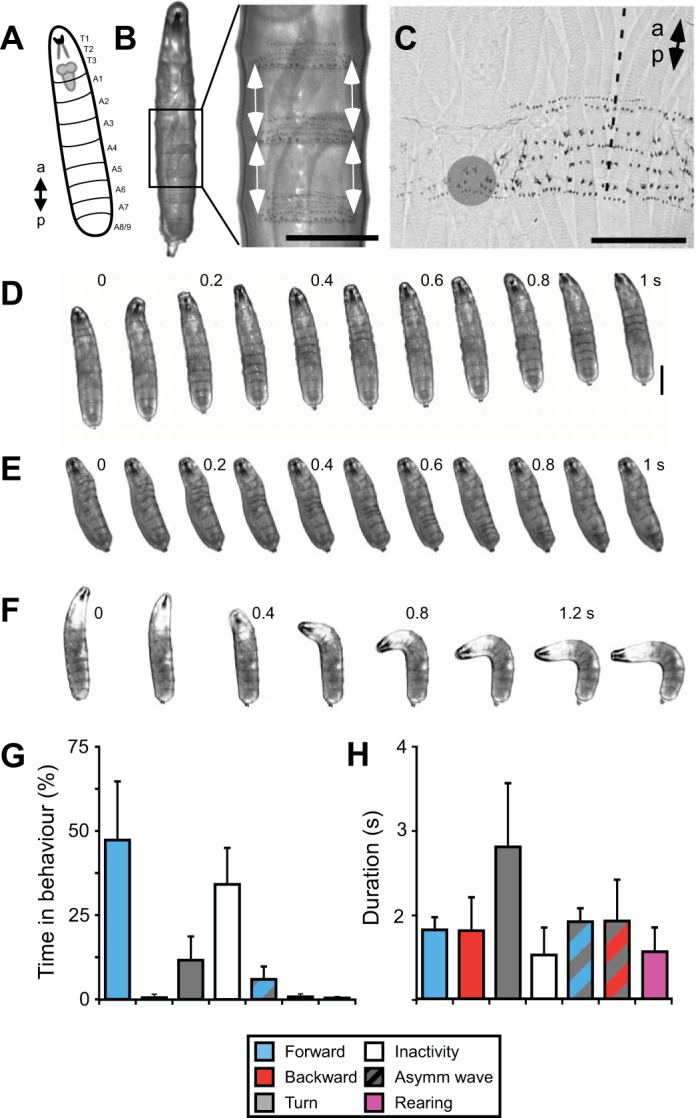
Fig. 7.

Kinematics of larval locomotion. A: diagram of larva with position of CNS shown. B: ventral view of 3rd instar larva. The contraction of each body segment was measured by manually tracking the distance between adjacent denticle bands (indicated with arrows). Scale bar, 0.5 mm. C: magnified view of denticle bands and tracking point (gray circle) in a fixed preparation. Dashed line indicates ventral midline. Scale bar, 0.2 mm. D–F: ventral view of larva during forward crawling (D), backward crawling (E), and turning (F). Scale bar, 1 mm. Numbers indicate time in seconds. G and H: quantification of frequency of occurrence (G) and duration (H) of each behavior.
