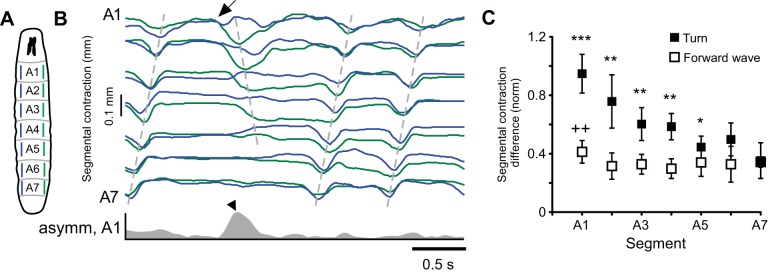
Fig. 8.
Bilateral asymmetry during turning behavior. A: diagram of larva with measured segments indicated. B: representative trace of segmental contraction during a turn. Dashed lines drawn manually over peaks for guidance. Commencement of turn indicated with arrow. Asymmetry between the left and right sides of the animal is shown for A1 (gray trace, bottom). Peak asymmetry during turn is indicated (arrowhead). C: peak bilateral asymmetry for forward waves and turns. Crosses indicate significant difference from least asymmetric segment, A4, during forward waves. Asterisks indicate segments showing significantly greater asymmetry during turns than during forward waves (Kruskal-Wallis 1-way ANOVA, Neuman Keuls, post hoc tests). *P < 0.05, ++/**P < 0.01, ***P < 0.001.

