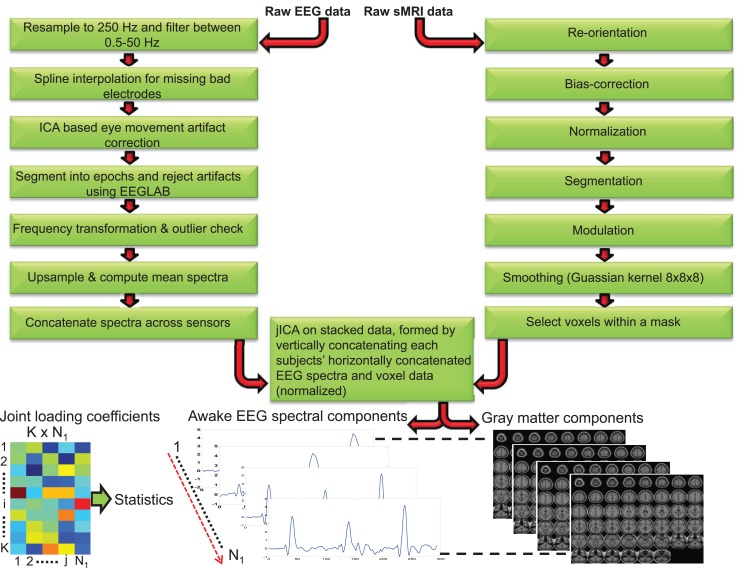
Figure 1.
Schematic depicting the processing steps for awake electroencephalogram and gray matter data. The processed EEG spectra (concatenated spatially) and voxels data (both data normalized) were concatenated for each subject and Joint Independent component analysis (jICA) was applied on the stacked data (vertically concatenated across all K = 607 subjects). N1 = 7 components were derived using jICA. The component whose loading coefficient revealed between-group differences was segmented to yield the EEG frequency and linearly associated gray matter component. The dotted line between the components indicates linearly paired EEG frequency and gray matter sources obtained from jICA.

