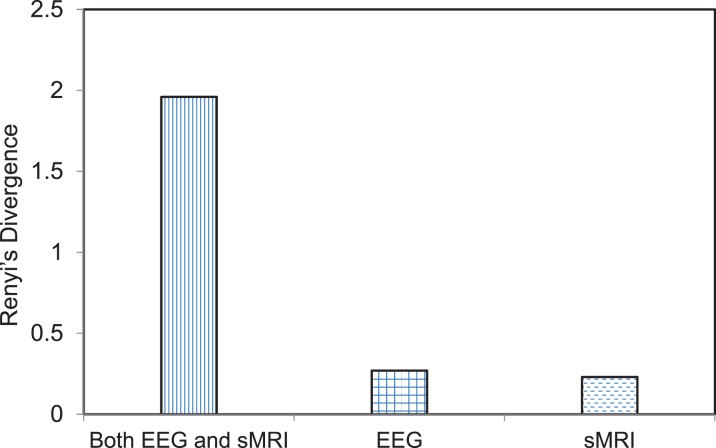
Figure 5.
Bar graph depicting the divergence score on the individual and combined feature space. The feature space includes joint electrophysiology (EEG) frequency activity and gray matter volumes (GMV) and either of the two separately. Renyi’s divergence compares the distribution of the back-reconstructed component between schizophrenia probands and healthy comparison groups. The divergence is calculated for the component that best separated the two groups for the joint modality (EEG + sMRI) as well for each modality. The p values associated with the divergence measure for the joint modality as well as the individual EEG and GMV data were p = 0.11, 0.36, and 0.45, respectively. The statistic associated with the divergence was evaluated by re-running (N = 500) the back-reconstruction with shuffled group labels and evaluating the ratio of the number of times the divergence measure exceeded the original value to the total number of runs.

