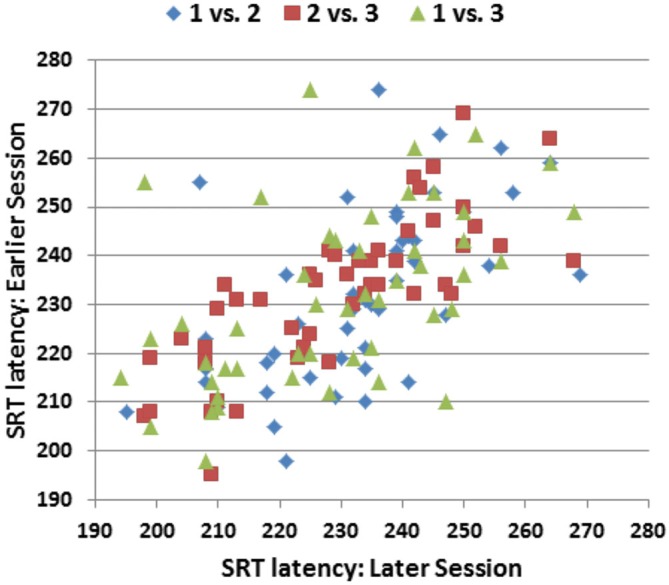
Figure 5.

SRT latencies of individual participants in the three replications of Experiment 1. The ordinate shows the SRT latencies from the earlier session and the abscissa shows the SRT latencies from the later session. Pearson correlations were r = 0.59 (Session 1 vs. Session 2), r = 0.80 (Session 2 vs. Session 3), and r = 0.53 (Session 1 vs. Session 3).
