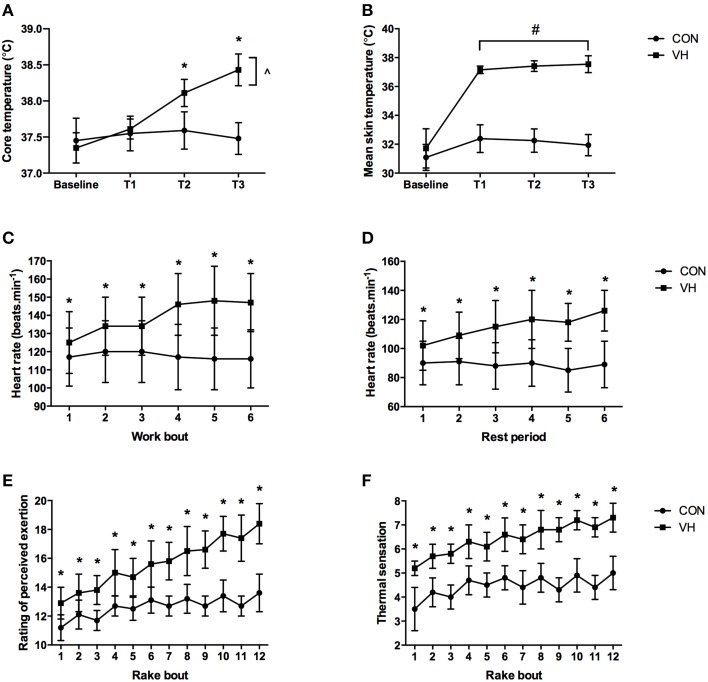
Figure 3.
Differences between the CON and VH conditions in: (A) hourly core temperature, (B) hourly mean skin temperature, (C) heart rate during the 10-min work bouts, (D) heart rate during the 20-min rest periods, (E) RPE after the 60-s rake bouts, and (F) thermal sensation after the 60-s rake bouts. *Indicates that VH significantly higher (P < 0.05) than CON at individual time points. ∧Indicates significant increase from T1 to T2, and T2 to T3 (P ≤ 0.004) in the VH. #Indicates VH higher than CON (main effect; P < 0.001).

