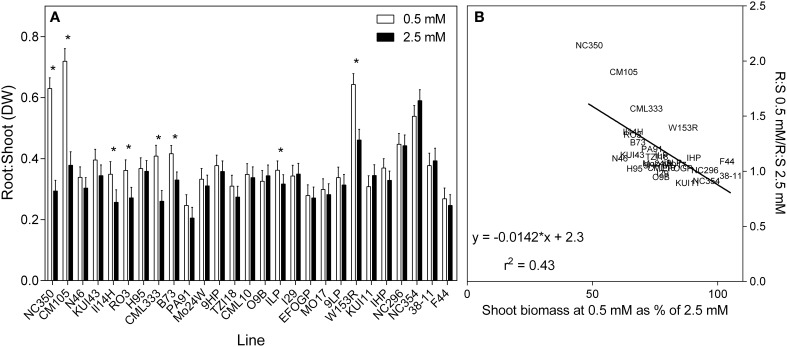
Figure 3.
Ratio of root to shoot dry weights of 21 day old maize genotypes grown at either 0.5 mM or 2.5 mM (values are predicted values ± standard error, n = 8). (A) Genotypes are ordered from left to right according to their ability to retain biomass as shown in Figure 2 and (B) the scatterplot displaying the regression describing the relationship.

