Figure 5.
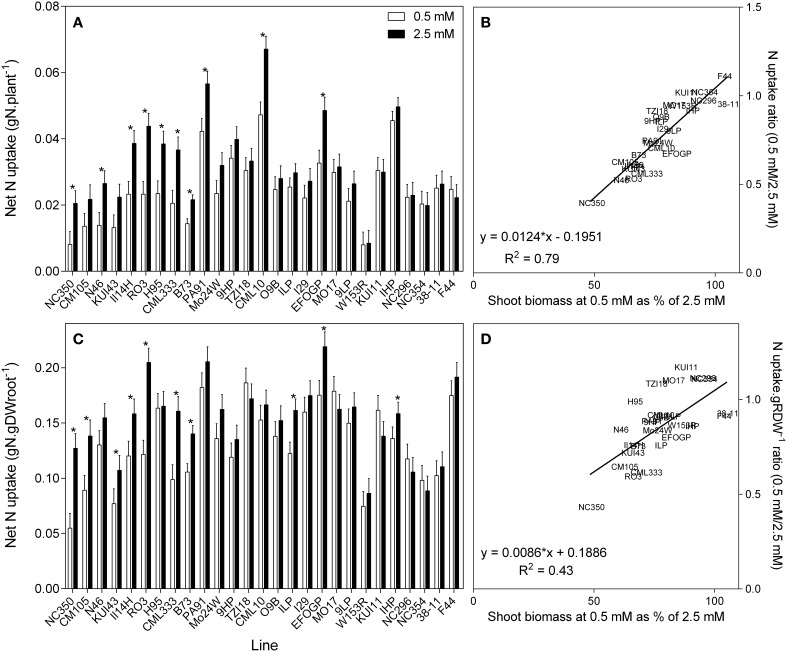
Net nitrogen uptake to the shoot (A), and net nitrogen uptake to the shoot relative to root size (C) of 21 day old maize genotypes grown at either 0.5 mM nitrate or 2.5 mM (values are predicted values ± standard error (n = 8), * indicates those points that are significantly different between the two growth conditions at 0.05 significance level. Genotypes are ordered from left to right according to their ability to retain biomass as shown in Figure 2. Scatterplots (B,D) are the ratio of the values at each nitrate concentration plotted against ability to retain biomass.

