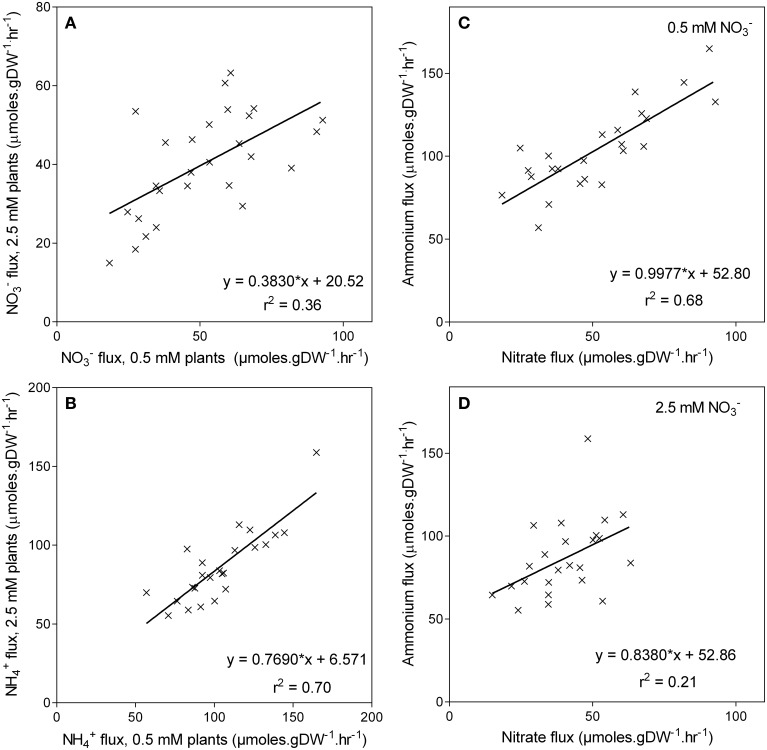
Figure 7.
Unidirectional influx of and into the roots of maize genotypes grown at either 0.5 mM or 2.5 mM . Panels (A,B) show the relationships between the fluxes of either (A) or (B) for each treatment; the relationship between the fluxes for each treatment is shown in Panels (C,D). Nitrate and influx were measured using15N labeled or over a 10-min influx period from a 200 μM solution.

