
Figure 4.
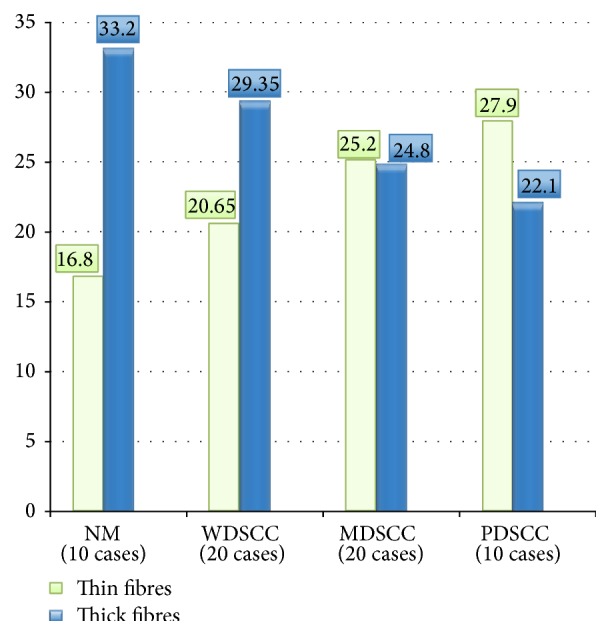
Thin and thick fibres arrangement in NM, WDSCC, MDSCC, and PDSCC (out of 50 fibres). ANOVA analysis: F value: 124.31; P value: 0.0000; interpretation: highly significant.
Official websites use .gov
A
.gov website belongs to an official
government organization in the United States.
Secure .gov websites use HTTPS
A lock (
) or https:// means you've safely
connected to the .gov website. Share sensitive
information only on official, secure websites.
Thin and thick fibres arrangement in NM, WDSCC, MDSCC, and PDSCC (out of 50 fibres). ANOVA analysis: F value: 124.31; P value: 0.0000; interpretation: highly significant.