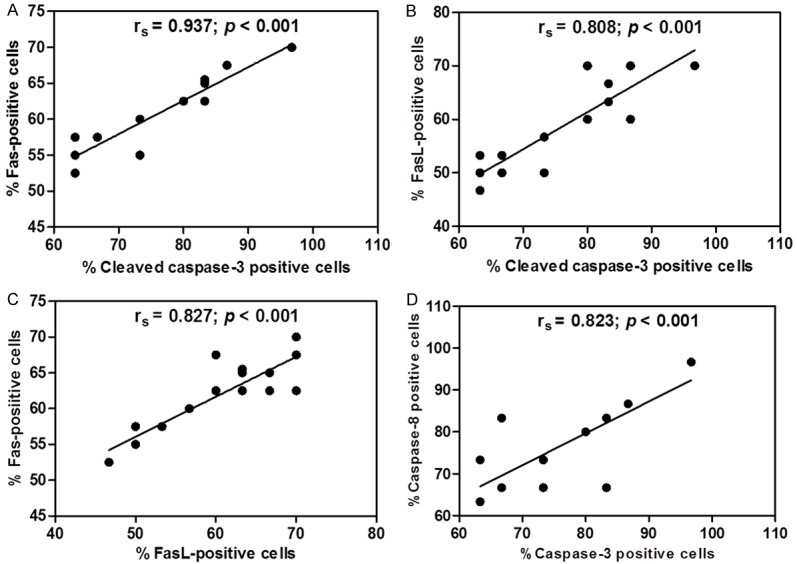
Figure 6.

The graphs illustrate positive correlations in the lung tissues of the PE group (n = 18) using Spearman’s rank correlation test. Positive correlations between the percentage of positive stained cells for Fas and the percentage of positive stained cells for cleaved caspase-3 (A), the percentage of positive stained cells for FasL and the percentage of positive stained cells for cleaved caspase-3 (B), the percentage of positive stained cells for FasL and the percentage of positive stained cells for FasL (C), and the percentage of positive stained cells for cleaved caspase-8 and the percentage of positive stained cells for cleaved caspase-3 (D).
