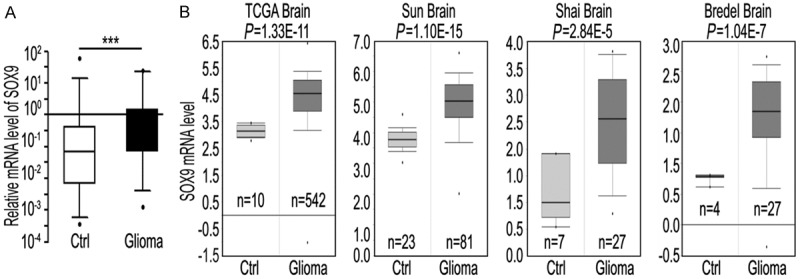
Figure 1.

SOX9 expression is upregulated in human glioma samples. A: SOX9 mRNA level in 32 pairs of glioma and adjacent non-cancerous brain tissue (control) samples. Values shown (Y axis represents relative expression units) are normalized to GAPDH. ***P < 0.001. B: Four glioma gene expression studies are analyzed using Oncomine (http://www.oncomine.org). SOX9 is significantly upregulated at the mRNA level in glioma samples as compared to the control brain tissues in all four datasets (TCGA, Sun et al., Shai et al., Landi et al., and Bredel et al.). Box and whisker plots: dots represent maximum and minimum values; whiskers show 90th and 10th percentiles; boxes show 75th and 25th percentiles; and the line indicates the median value. P-values were computed using Oncomine software and the Student t-test. Ctrl: control brain tissue samples.
