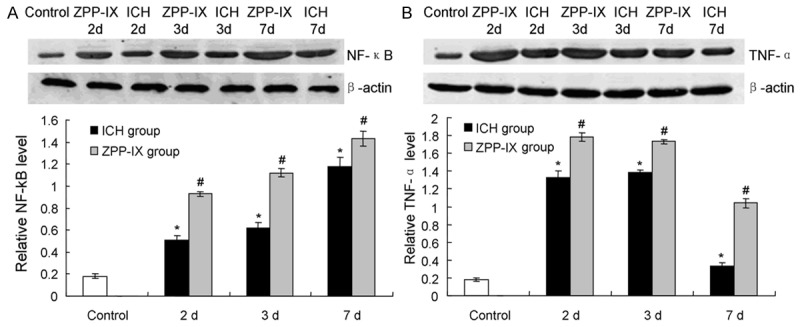
Figure 4.

Inflammatory cytokines activation in ZPP-IX group by western blot assay detection. A. Western blot assay and statistical analysis for the NF-κB expression. B. Western blot assay and statistical analysis for the TNF-α expression. *P < 0.05 represents the NF-κB or TNF-α level in ICH group compared to the normal group. #P < 0.05 represents the NF-κB or TNF-α level in ZPP-XI group compared to the ICH group.
