
Figure 5.
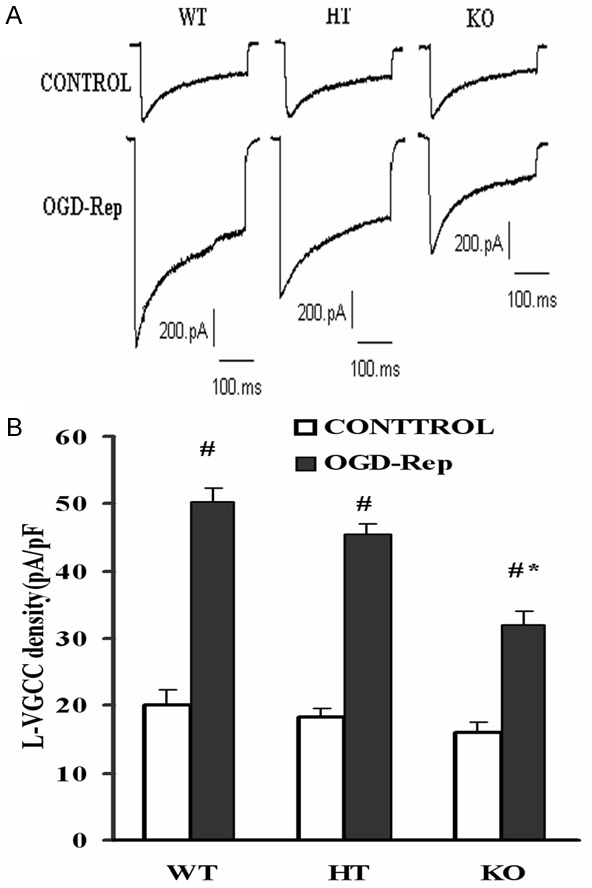
L-VGCC activation after OGD-Rep in three types of cortical neurons. Cells were treated with OGD-Rep and collected for whole-cell patch-clamp recording. A. Typical L-VGCC current recorded in three types of neurons before and after OGD-Rep. B. Analytical plot showing a dramatic increase of current density in all neurons after OGD-Rep. Data are the mean ± SD in each group. #P<0.05 vs control, *P<0.05 vs corresponding wild-type or heterozygote group. WT: Wild type cells; HT: Heterozygote cells; KO: PICK1 knockout cells.