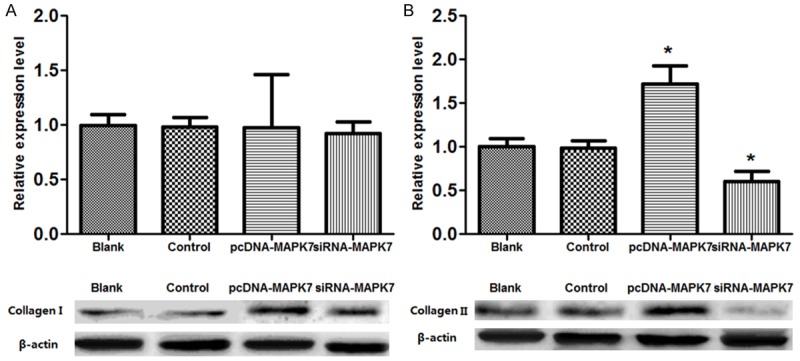
Figure 5.

Western blotting analyze of collagen expression in OVCAR-3 cells. A: Expression of type I collagen in pcDNA-MAPK7 group was 1.2 fold change of control or Blank group, while that in siRNA-MAPK7 group was 1.1 fold change of the control group; B: Expression of type I collagen in pcDNA-MAPK7 group was 1.8 fold change of control or Blank group, while that in siRNA-MAPK7 group was 0.7 fold change of the control group. *P<0.05, compared with the control group.
