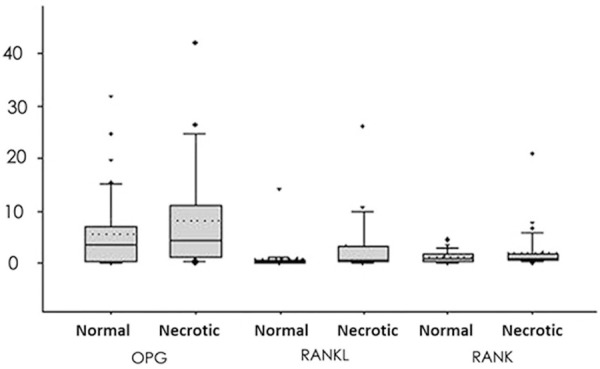
Figure 3.

mRNA levels of OPG, RANKL and RANK genes. The box-plot displayed 25% quartile, mean and 75% quartile, in addition to 10% and 90% error bar. Medians were given by dashed lines while outraged data points showed minimal/maximal values. The expression of RANK/RANKL in necrotic tissues was significantly increased compared to controlled ones.
