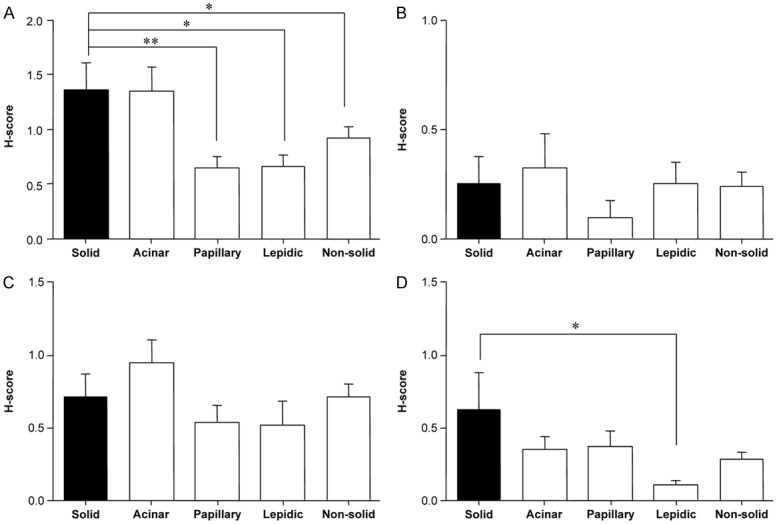
Figure 2.

Expression levels of predictive chemotherapy biomarkers according to histological subtypes. A: TS, B: ERCC1, C: RRM1, D: class III β-tubulin. Quantitative estimation of immunohistochemical staining was summarized by the H-score, as described in the methods. Vertical axis: the value of the H-score in both predominant and non-predominant tissue. Horizontal axis: histological subtypes. Non-solid refers to the combination of all subtype groups except solid. *P < 0.05 and **P < 0.01, as compared with H-scores for solid components. TS, thymidylate synthase; ERCC1, excision repair cross complementation group 1; RRM1, ribonucleotide reductase M1.
