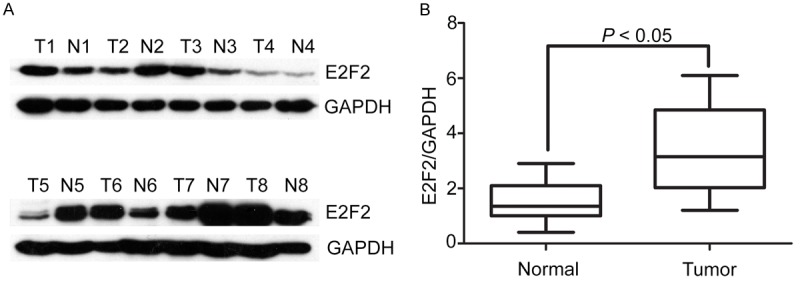
Figure 1.

Expression of E2F2 in NSCLC tissue samples by western blot. A. Protein levels of E2F2 in NSCLC tissue samples by western blot. Representative images of E2F2 expression were presented. The ratio of E2F2/GAPDH was indicated below. B. Relative intensity of E2F2 normalized to GAPDH was calculated (n = 8).
