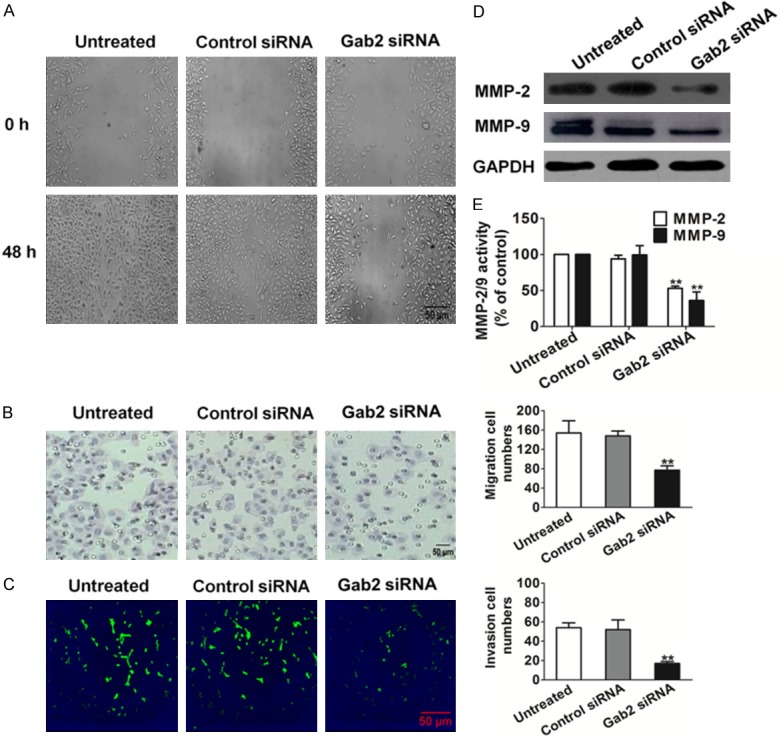
Figure 2.

Effects of Gab2 silencing on H1975 cell motility. A. Representative examples of wounding experiment results from control and siRNA-Gab2 H1975 cells. Representative pictures of the wound distance were taken at each time point as indicated. Scale bars: 50 µm. B. H1975 motility was also estimated by Transwell assay. Representative pictures were taken after staining with crystal violet. Scale bars: 50 µm. C. H1975 cells that invaded through the pores to the lower surface of Matrigel-coated chambers were labeled with green a fluorescent probe DiOC18(3). Invaded cells transfected with control- or Gab2-siRNA were evaluated on the basis of the mean values from five fields for each group. Scale bars: 50 µm. D. Total cell lysates were isolated after control- or Gab2-siRNA transfection and MMP-2/9 expression levels were detected by western blotting. E. Quantification of MMP-2/9 activity. Bars are represented as the mean ± SD, n = 5, **P < 0.01 versus untreated cells.
