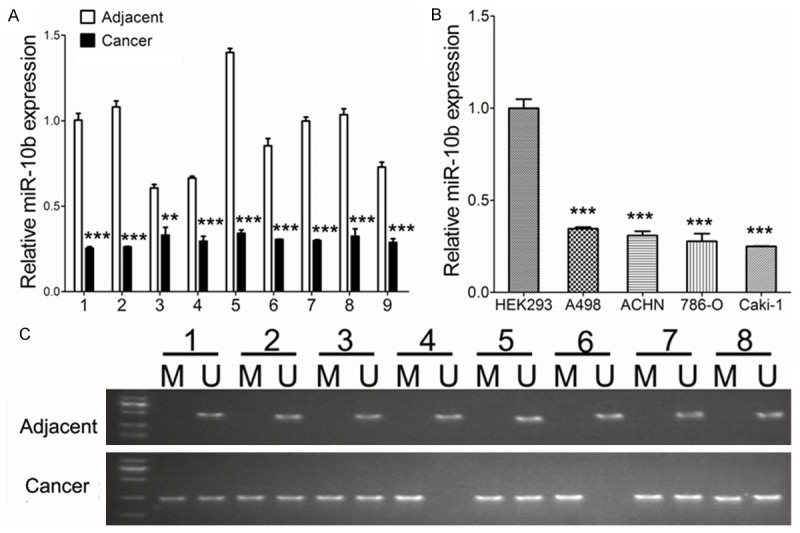
Figure 1.

MiR-10b expression and CpG island methylation. A: MiR-10b expression levels were significantly lower in ccRCC tissues than that of in matched adjacent tissues. B: MiR-10b expression levels were significantly lower in renal cancer cell lines than those in HEK293 controls. C: MSP test results indicated that methylation of miR-10b promoter was higher in ccRCC tissues than that of in matched adjacent tissues. Data are presented by means ± s.d, *P<0.05, **P<0.01, ***P<0.001 vs. control.
