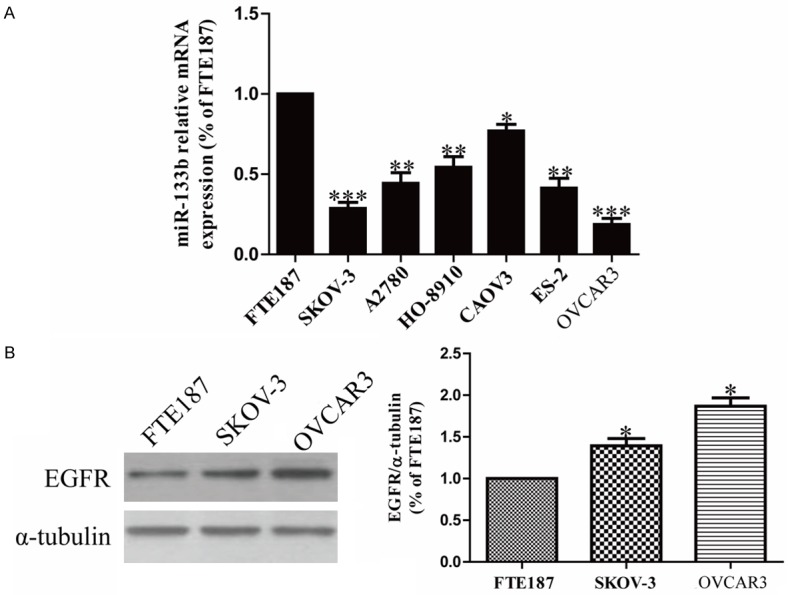
Figure 1.

The altered expression of miR-133b and EGFR in OC cell lines. A. The relative expression of miR-133b in OC cell lines and FTE187 cell line by real-time PCR. B. EGFR protein level in SKOV-3 and OVCAR3 cells compared with FTE187 cell were determined by Western blotting. α-tubulin was detected as a loading control. All data are presented as mean ± SEM, n=6. *P<0.05, **P<0.01, ***P<0.1 vs. FTE187.
