
Figure 1.
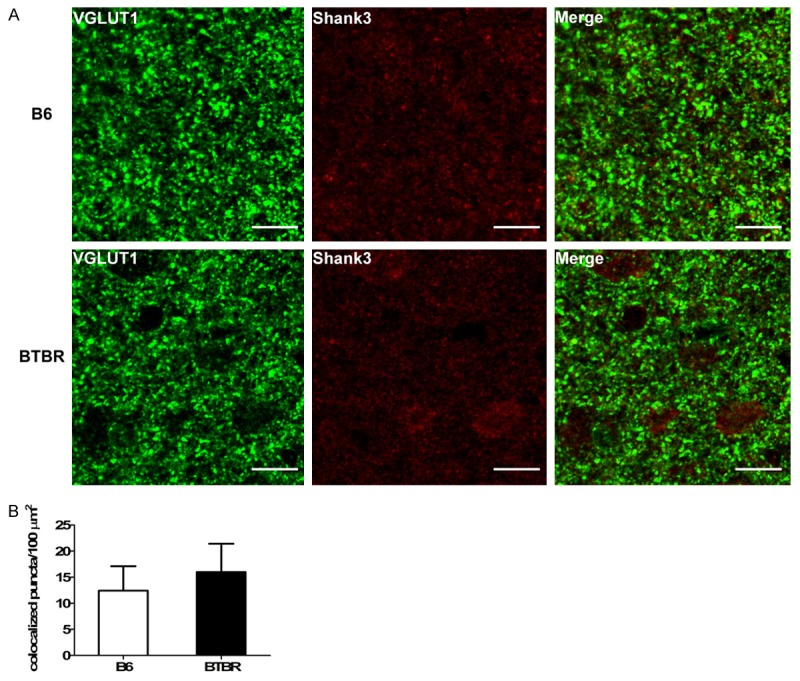
Quantification of colocalization of pre- and post-synaptic puncta. A. Representative immunofluorescence images of B6 and BTBR cortex immunolabeled for pre-synaptic VGLUT1 and post-synaptic Shank3. Scale bar, 10 µm. B. Quantification of colocalization of pre- and post-synaptic markers in brain sections. No difference was observed between B6 and BTBR brains (P>0.05). Data are shown as mean ± SEM.