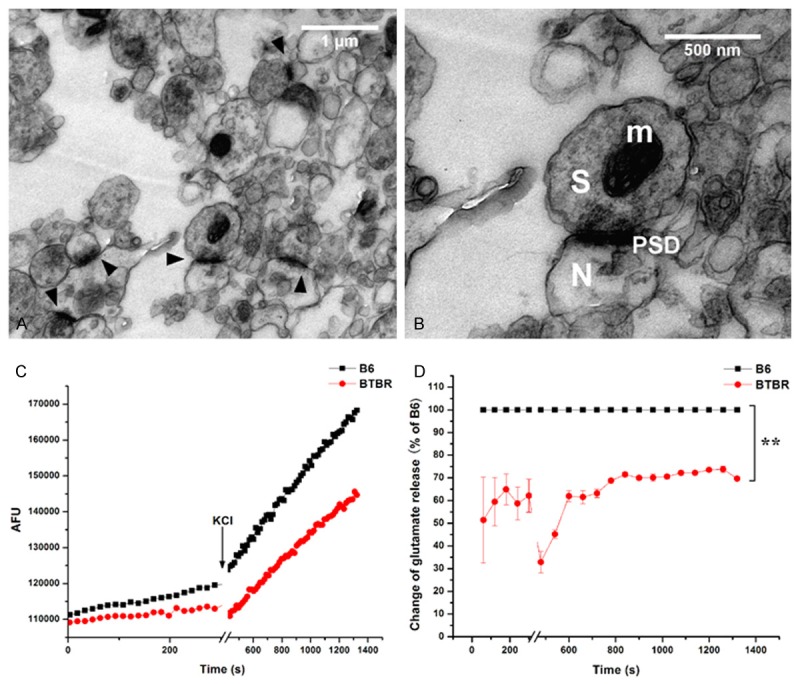
Figure 4.

Glutamate release of synaptoneurosomes. A. Electron micrographs of representative sample of synaptoneurosomes isolated from BTBR mouse cortex. Arrowhead indicates synaptic junctions. B. Higher magnification of the synaptic site where the pre-synaptic terminal displays vesicles and a post-synaptic membrane contains PSDs. Synaptosome (S), neurosome (N), and densely stained membranes that characterize PSDs (PSD) are shown. Mitochondria (m) also are present. C. A typical experimental trace for glutamate release each assay is shown. AFU: arbitrary fluorescence units. D. Relative comparison of glutamate release in synaptoneurosomes between B6 and BTBR mice. **P<0.01.
