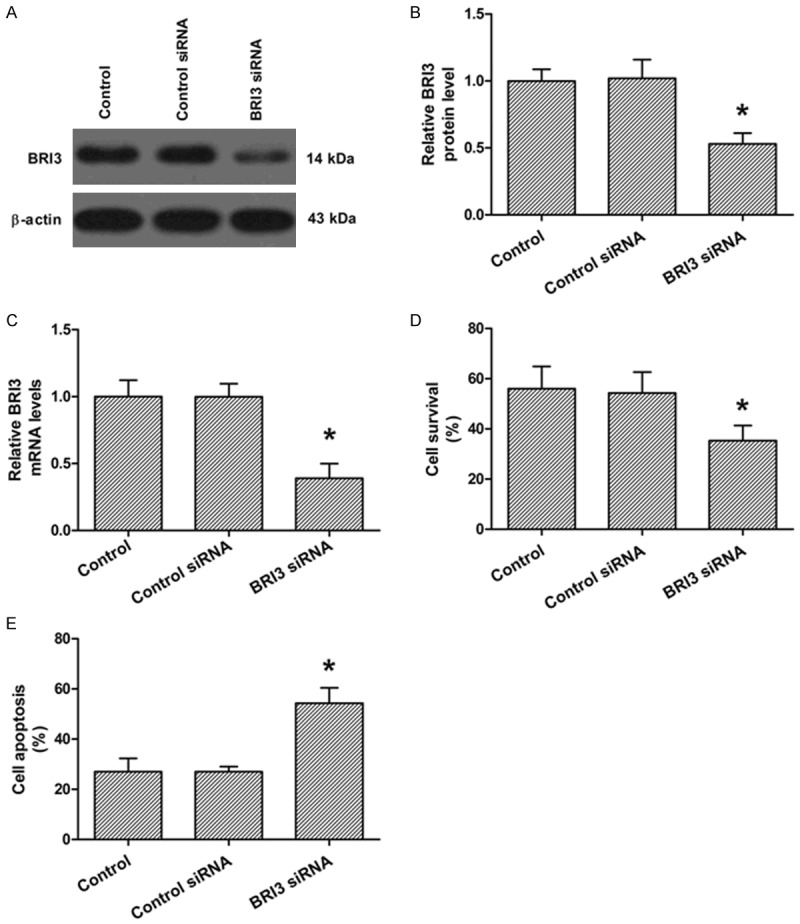
Figure 4.

Effects of BRI3 expression on rat hippocampal neurons. A. Western blot analysis of the protein levels of BRI3 afterBRI3 siRNA or control siRNA transfection. B. Quantization of A. C. Real-time PCR analysis of the mRNA levels of BRI3 was determined afterBRI3 siRNA or control siRNA transfection. D. XTT analysis of neuronal survival after BRI3 siRNA or control siRNA transfection. E. Flow cytometry analysis of neuronal apoptosis after BRI3 siRNA or control siRNA transfection. The data presented as mean ± SD. *P<0.05 compared to the control group.
