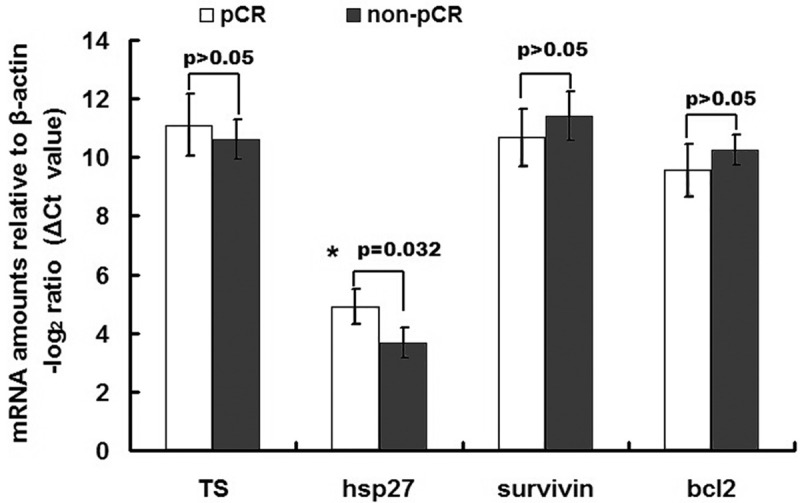
Figure 3.

Comparison of the expression levels of some previously identified marker genes in rectal cancer samples. A cohort of 40 patients was assayed for gene expression levels by qRT-PCR, among which 20 showed pCR and 20 showed non-pCR. The data are expressed as delta CT values normalized to β-actin; therefore a higher value represents a lower expression level. There were no significant differences between groups (pCR vs. non-pCR) in the gene expressions of Survivin, Thymidylate synthase (TS) or Bcl2, all of which have been suggested by previous studies to serve as biomarkers for the responsiveness of patients to neoadjuvant chemoradiation therapy. However, the gene expression of Hsp27 was significantly lower in the pCR group than in the non-pCR group.
