
Figure 1.
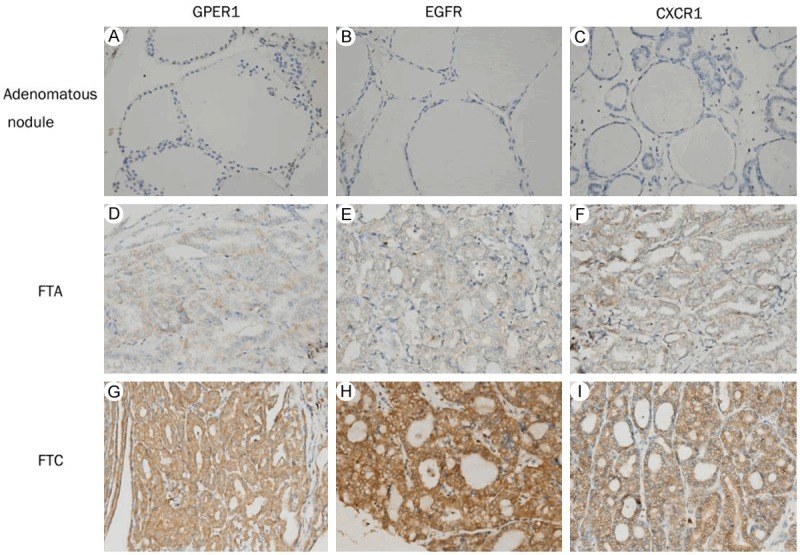
Immunohistochemical staining for GPER1, EGFR and CXCR1. Columns correspond to immunostaining for GPER1, EGFR and CXCR1, respectively. The first row exhibits weak staining of adenomatous nodules with the indicated antibodies (A-C); the second row shows moderate staining of FTA (D-F); and the third row displays strong staining of FTC (G-I). All the pictures are in high-power fields (×400).