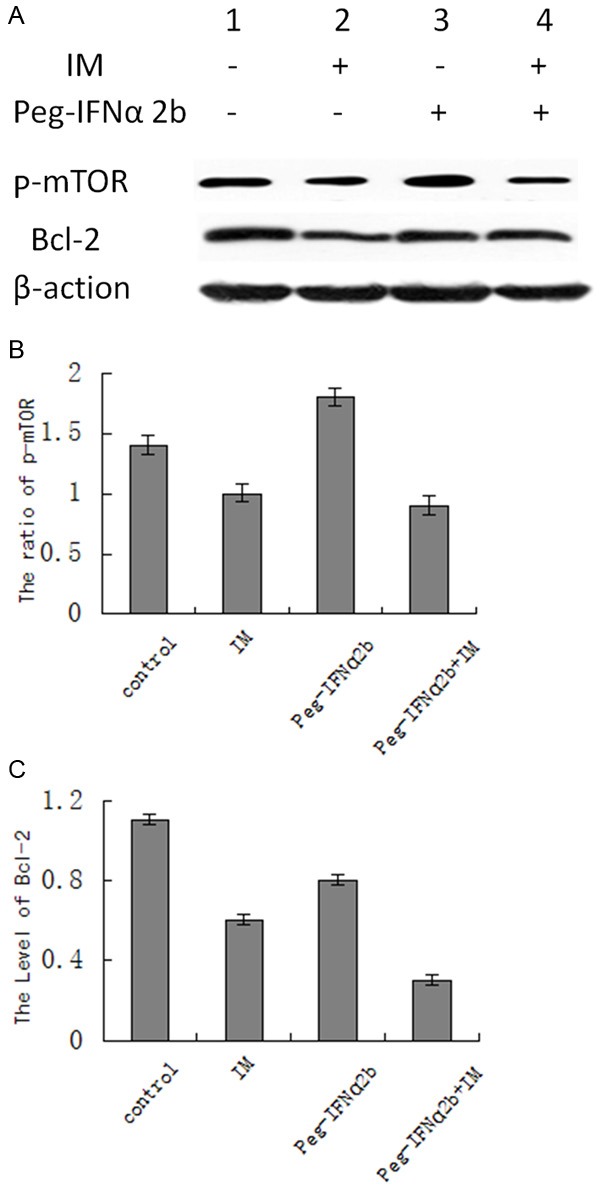
Figure 2.

The expression levels of p-mTOR and Bcl-2 of GIST-R cells in different treatment groups were analyzed by Western. A: Protein blotting stripe. B: The relative content of mTOR protein. C: The relative content of Bcl-2 protein. 1: Control group; 2: IM group; 3: Peg-IFNα-2b group; 4: Peg-IFNα-2b and IM group.
