
Figure 4.
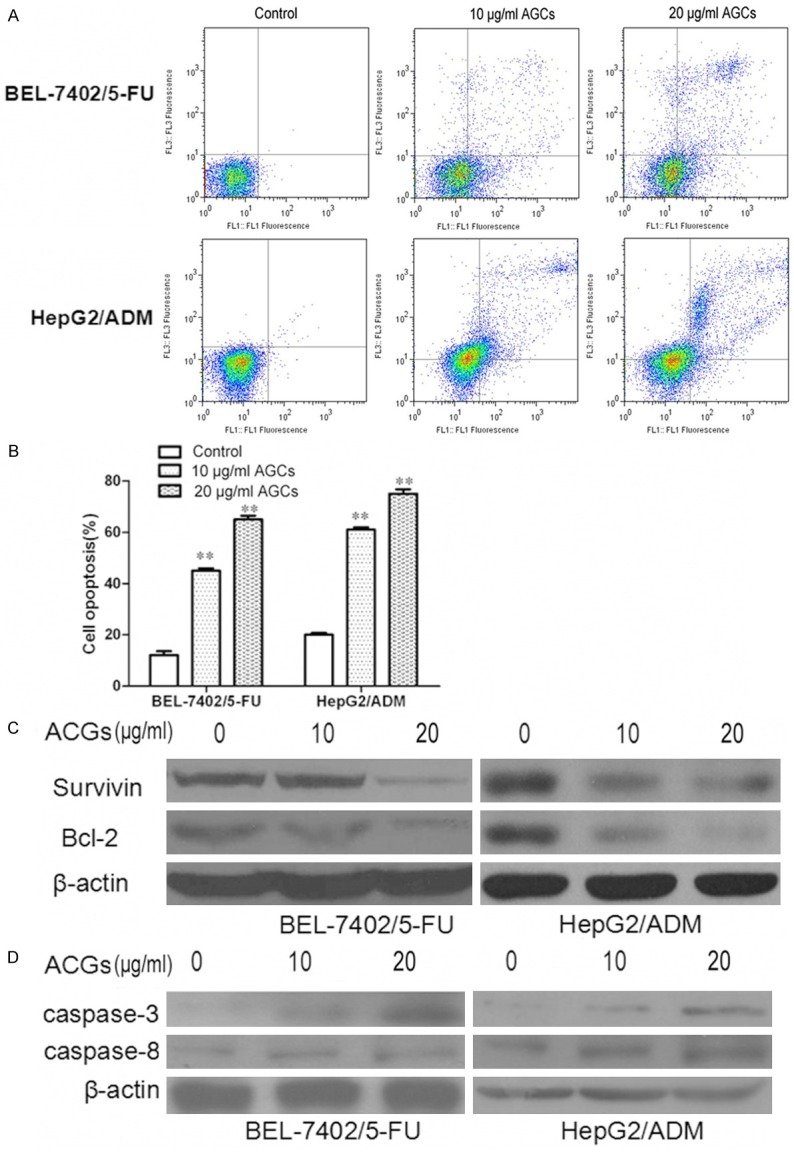
Annonaceous acetogenins induced cell opoptosis in BEL-7402/5-FU and HepG2/ADM cells. A. Cells were treated with 10 µg/ml and 20 µg/ml Annonaceous acetogenins for 24 h. Annexin V-FITC/PI analysis by FCM was used to analyze the percentage of apoptotic cells in BEL-7402/5-FU and HepG2/ADM cells; B. Histogram of the percentage of apoptotic cells in BEL-7402/5-FU and HepG2/ADM cells. C. The expression of survivin and Bcl-2 proteins were determined by western blot in BEL-7402/5-FU and HepG2/ADM cells; D. mRNA expressions of survivin and Bcl-2 in BEL-7402/5-FU and HepG2/ADM cells. Data were presented as the mean ± SD and were representative of an average of three independent experiments per concentration. Significant differences from untreated control are indicated by P<0.05 (*) and P<0.01 (**).