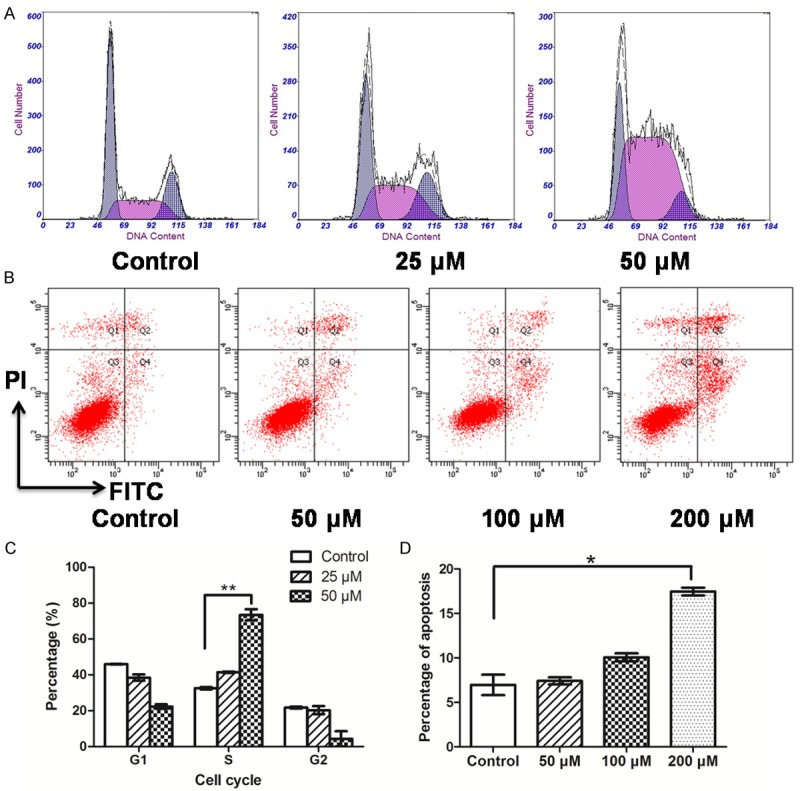
Figure 2.

Effects of NFA with different concentrations on cell cycle distribution and apoptosis of CNE-2Z. A. The cell cycle profile of CNE-2Z cells that were treated with 0, 25 and 50 μM of NFA in 1640 medium for 24 h were detected using flow cytometry. B. The apoptosis of CNE-2Z cells that were treated with 0, 50 and 100 μM of NFA in 1640 medium for 48 h were detected using flow cytometry. C. Comparisons between the percentages of cell cycle distribution of CNE-2Z with the different concentrations of NFA. D. Comparisons between the apoptosis percentage of CNE-2Z with the different concentrations of NFA on CNE-2Z cell.
