Figure 5.

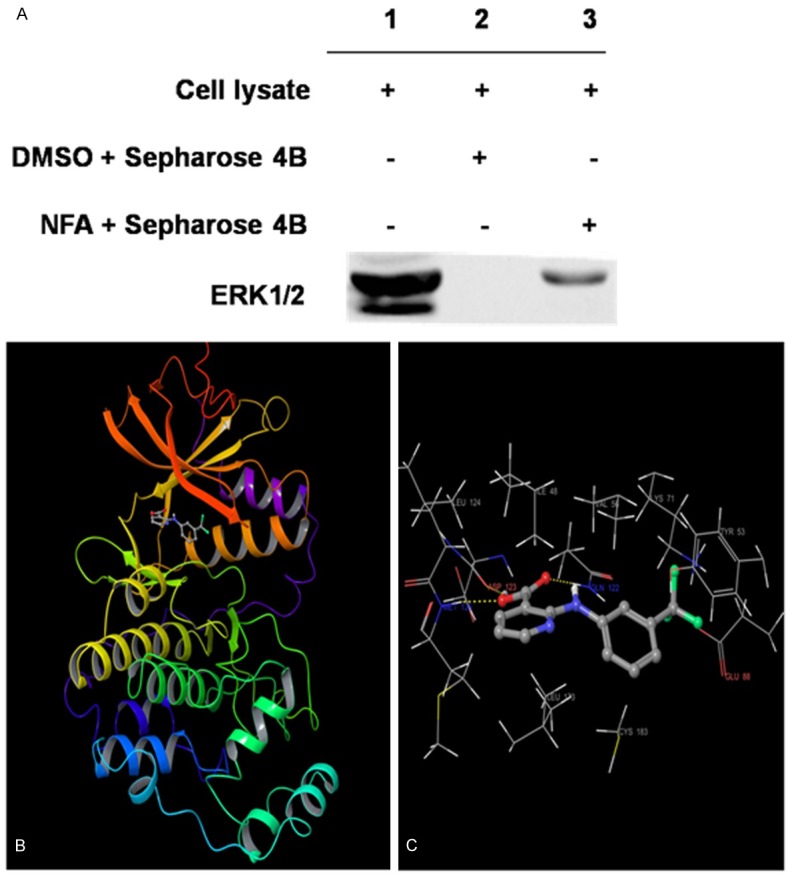
The correlation between NFA and ERK1. A. NFA was bound with ERK1. Lanes 1 show on total protein, lanes 2 and lanes 3 respectively show the solvent group and NFA group. B. The binding pose between NFA and ERK1. C. Hydrogen bonds between NFA and three residues of ASP123, MET125, and GLN122 in the ATP binding site of ERK1 (for clarity, the backbone atoms of 8 protein residues: ILE48, TYR53, VAL56, LYS71, GLU88, GLN122, LEU173 and CYS183 to form the hydrophobic interactions with NFA are not shown). Note: the α-helices are drawn as cylinders and the β-strands as arrows. NFA is shown in stick model and protein residues are shown in line model.
