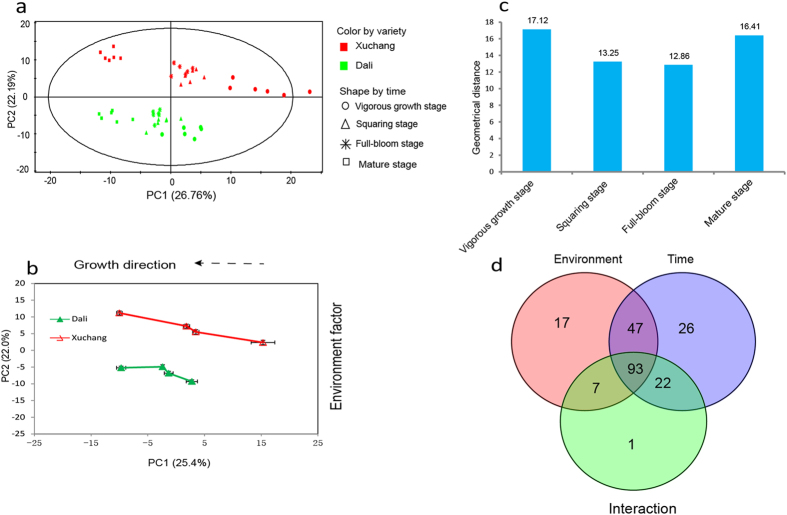
Figure 2. Time course of metabolic alterations in cv. K326 grown in Dali and Xuchang.
(a) PCA score plot of cv. K326 from Xuchang (red) and Dali (green) along the first and second principal components. (b) Time-dependent metabolic trajectory of the 2D PCA score plot during four developmental stages. Error bars represent the standard error of measurement (SEM) at each time point. (c) Euclidean distance plot between the two growing locations at every development stage. (d) Venn diagram of two-way ANOVA defining the significantly different variables associated with planting areas (environment) and growth stage (time) and showing their interactions.

