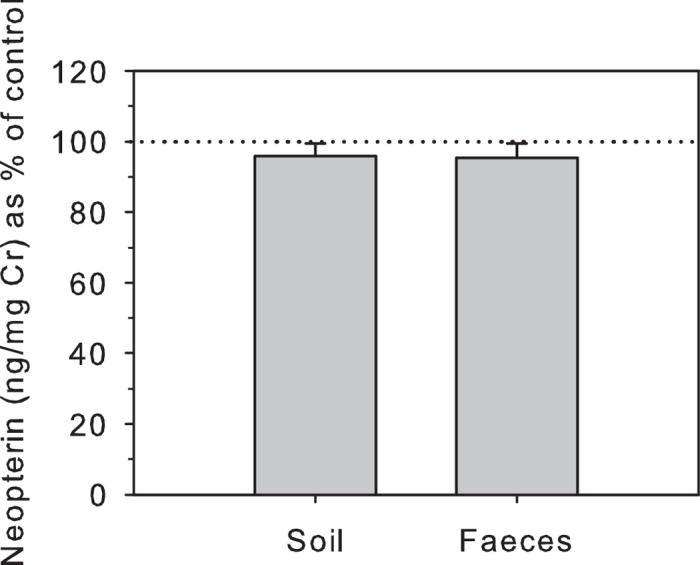
Figure 1. Effect of soil and faecal contamination of urine samples on urinary NEO (n = 12).

Urinary NEO concentrations are shown as percentage (mean ± s.e.m.) of control values (100% shown by dotted line).

Urinary NEO concentrations are shown as percentage (mean ± s.e.m.) of control values (100% shown by dotted line).