
Figure 5. Effect of exposing urine samples to one and three 24 h freeze/thaw cycles on urinary NEO.
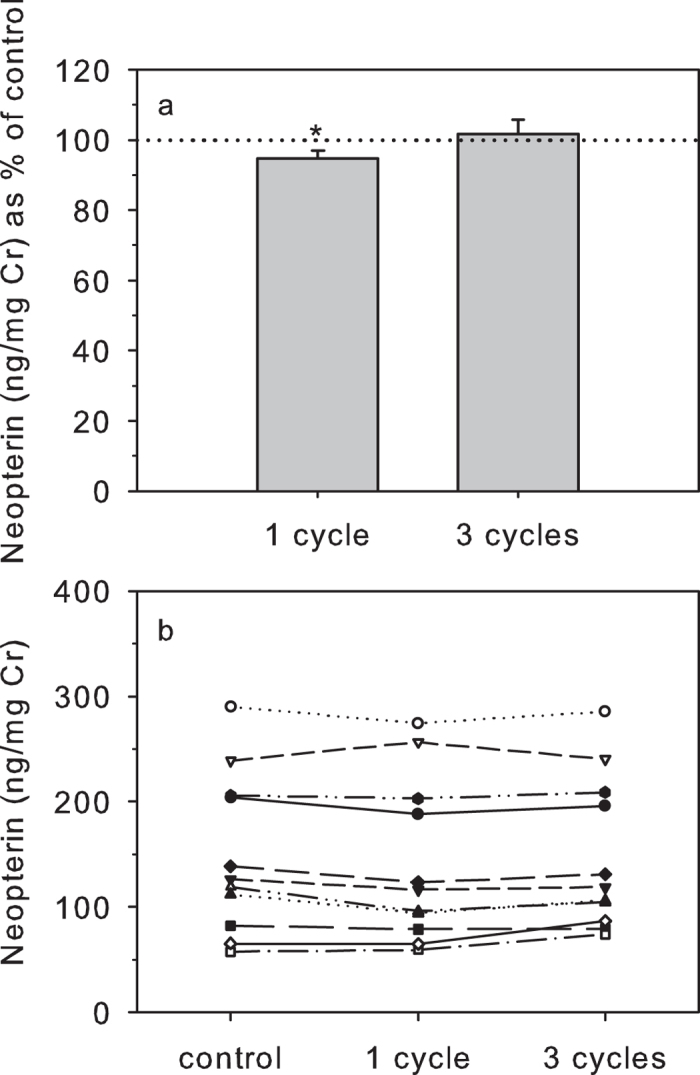
Urinary NEO concentrations are shown as: (a) percentage (mean ± s.e.m.) of control values (100% dotted line); and (b) absolute concentrations. For each treatment, *indicates concentrations that differ significantly from controls.