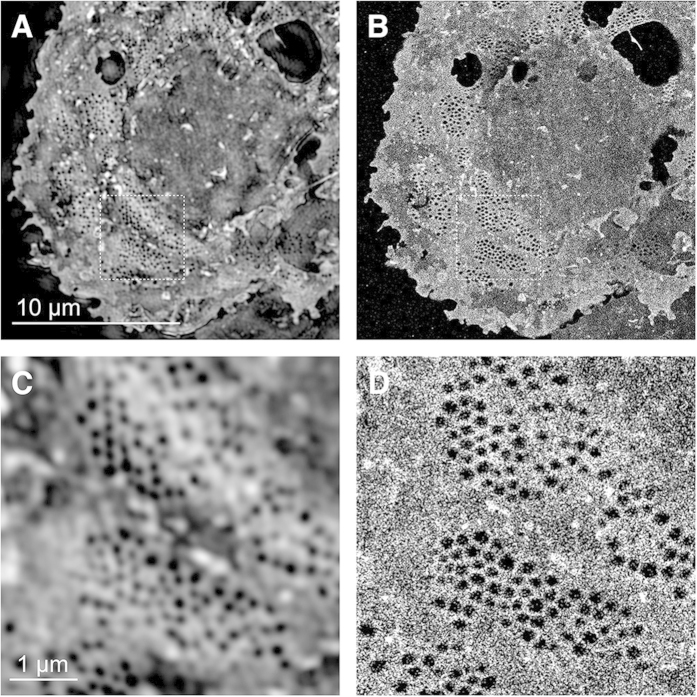
Figure 2. Comparison of 3D-SIM and dSTORM images of fenestrations in rat LSECs stained with Vybrant DiD.
(A,C) 3D-SIM and corresponding (B,D) dSTORM images of a fixed rat LSECs stained with Vybrant DiD. The cells were mounted in the reducing buffer OSS + MEA (see Materials and Methods). (C,D) show enlarged views of the corresponding ROIs shown in (A,B). The 3D-SIM image is a maximum intensity z-projection image of a 500 nm thick part of the cell. The exposure time for a single dSTORM frame was 20 ms and 15000 frames were processed to reconstruct the images shown in (B,D).

