
Figure 3. Stitching of multicolor 3D-SIM super-resolution images aids in the search for sieve plates in LSECs.
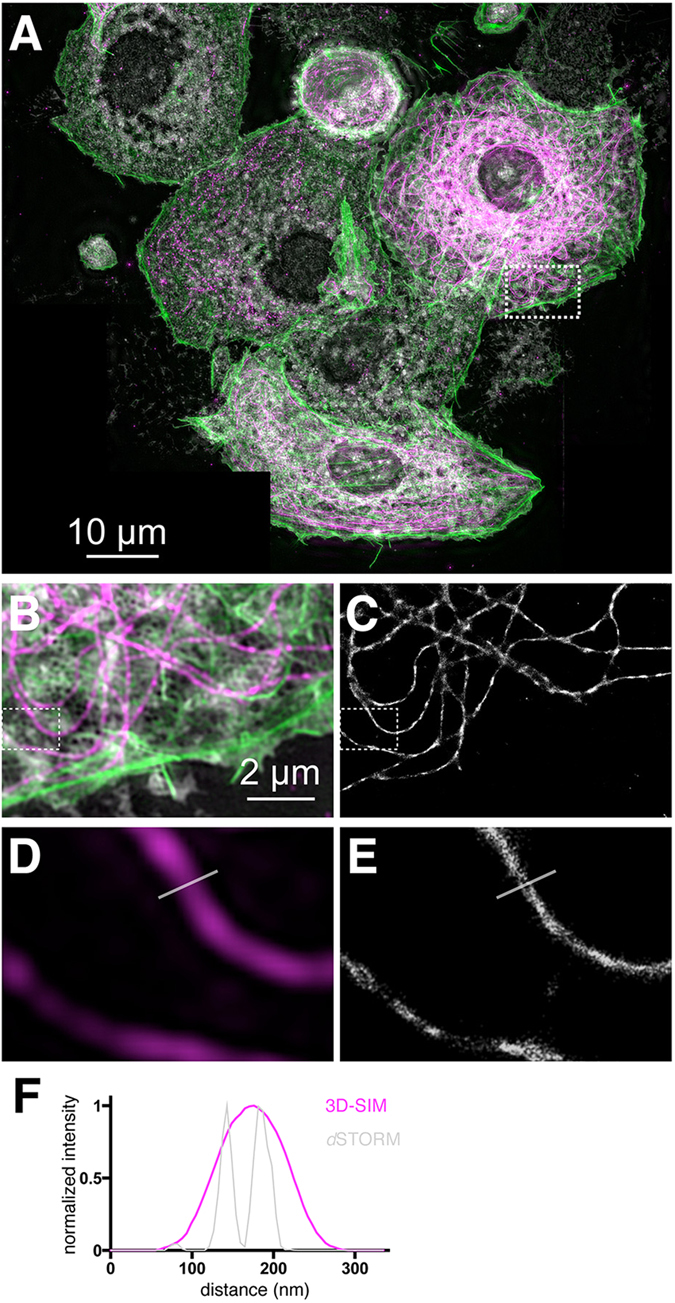
(A) Seven multi-color maximum intensity z-projection 3D-SIM images of LSECs were stitched together to produce a large-scale overview image. The fixed rat LSECs were stained for membranes (CellMask Orange, white), actin (Phalloidin-Alexa488, green) and tubulin (mouse anti-β-tubulin and anti-mouse-Alexa647 antibodies, magenta). Scale bar: 10 μm.(B) Enlarged view of the ROI shown in (A). Tubulin is shown in magenta. (C) Corresponding dSTORM reconstruction of the tubulin network. (D) Zoomed view of the β-tubulin channel (magenta) outlined in the 3D-SIM image in (B). (E) Corresponding dSTORM image of β-tubulin. The line indicating the location of the cross-section has a length of 330 nm. (F) The line sections of the 3D-SIM and dSTORM tubulin channels show the resolution enhancement achieved by dSTORM (green line) compared to 3D-SIM (magenta line). The exposure time for a single dSTORM frame was 20 ms. 10000 frames were used for the reconstruction.