
Figure 4. Comparison of cellular features imaged by different super-resolution microscopy modalities.
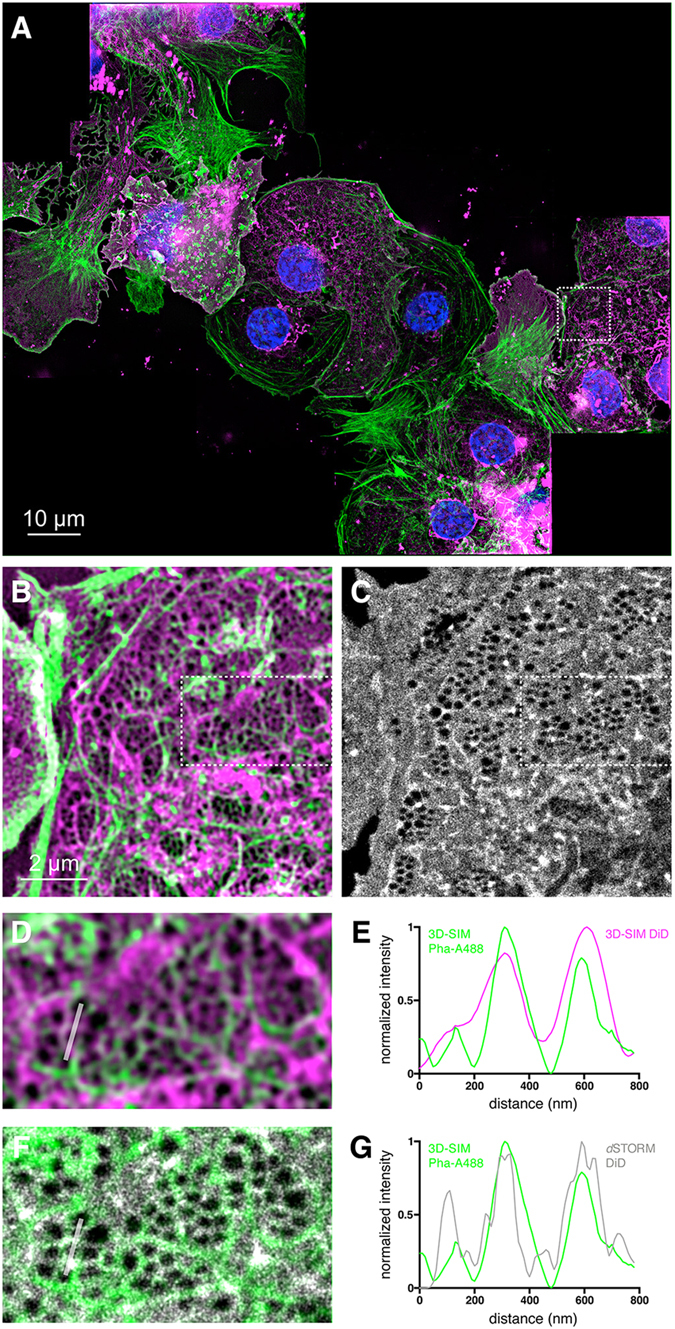
(A) Nine multi-color maximum intensity z-projection 3D-SIM images of fixed rat LSECs were stitched together to produce this overview image. The cells were stained for nuclei (DAPI, blue), actin (Phalloidin-Alexa488, green) and membrane (DiD, magenta). (B) Enlarged 3D-SIM view of the ROI shown in (A) highlighting how fenestrations are surrounded by actin fibers. (C) is the corresponding dSTORM image of the DiD membrane channel. (D) is an enlarged view of the ROI shown in (B). (E) Plot of the line section shown in (D) comparing the actin (green) and membrane (magenta) channels of the 3D-SIM image. (F) Overlay of the actin channel from 3D-SIM (D) shown in green and the membrane channel of dSTORM ((C), outlined box) shown in grey. (G) Plot of the line section shown in (F) comparing the 3D-SIM actin (green) and dSTORM membrane (grey) channels. (G) The actin line (green) shows the same trend as the membrane dSTORM line (grey), which suggests that actin filaments support fenestrations.