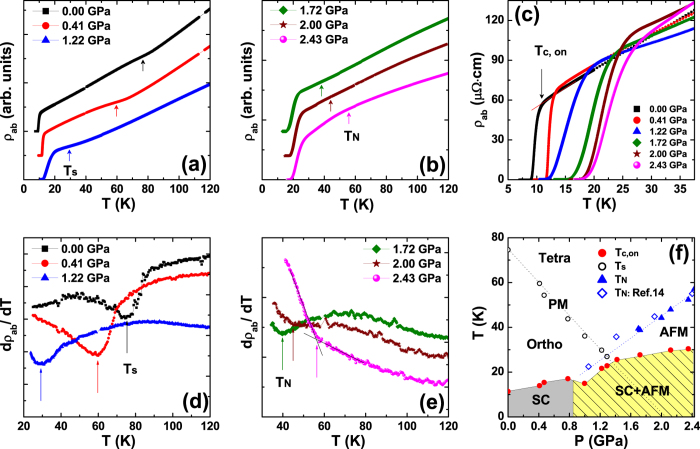
Figure 1. Electrical resistivity and phase diagram of FeSe single crystals.
(a,b) In-plane electrical resistivity (ρab) is plotted as a function of temperature for selective pressure. Arrows mark the structural (Ts) and antiferromagnetic phase transition (TN) in (a,b), respectively. ρab for different pressures was rigidly shifted upwards for clarity. (c) ρab is magnified near the superconducting transition region, where Tc,on is defined as the onset temperature of the SC phase transition. (d,e) First temperature derivative of the resistivity is shown as a function of temperature. Arrows mark Ts and TN in (d,e), respectively. (f) Temperature-pressure phase diagram of FeSe. SC, AFM, and PM stand for superconducting, antiferromagnetic, and paramagnetic phase, respectively. Tetra and Ortho are the acronym of tetragonal and orthorhombic crystal structure.

