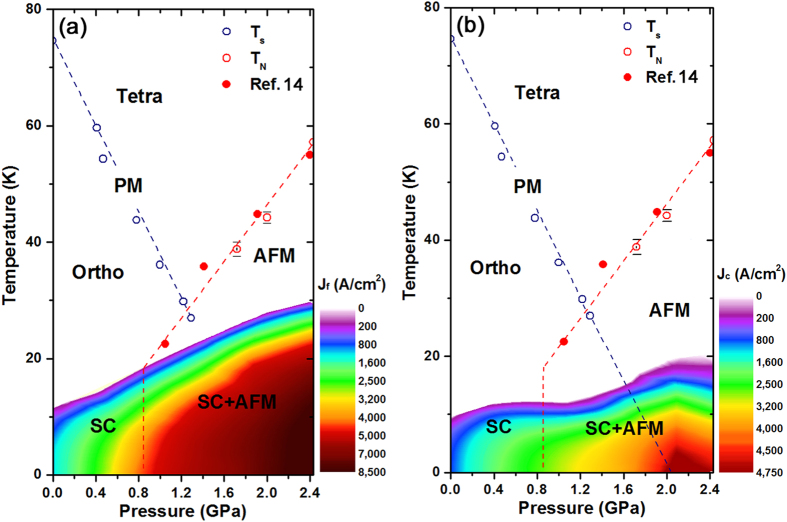
Figure 4. Phase diagram of the critical current densities, Jf and Jc.
(a) The free-flux-flow critical current density (Jf), above which vortices flow freely, is plotted as a function of temperature and pressure. Here, the colour represents the absolute value of Jf. The magnetic and the superconducting (SC) transition temperatures based on the resistivity measurements are also plotted. For reference, we show the phase transition temperature from paramagnetic (PM) to antiferromagnetic (AFM) states based on the μSR measurements in ref. 14 (solid red circles). (b) A contour map of the depinning critical current density (Jc) is plotted as a function of temperature and pressure, where the colour represents the absolute value of Jc.

